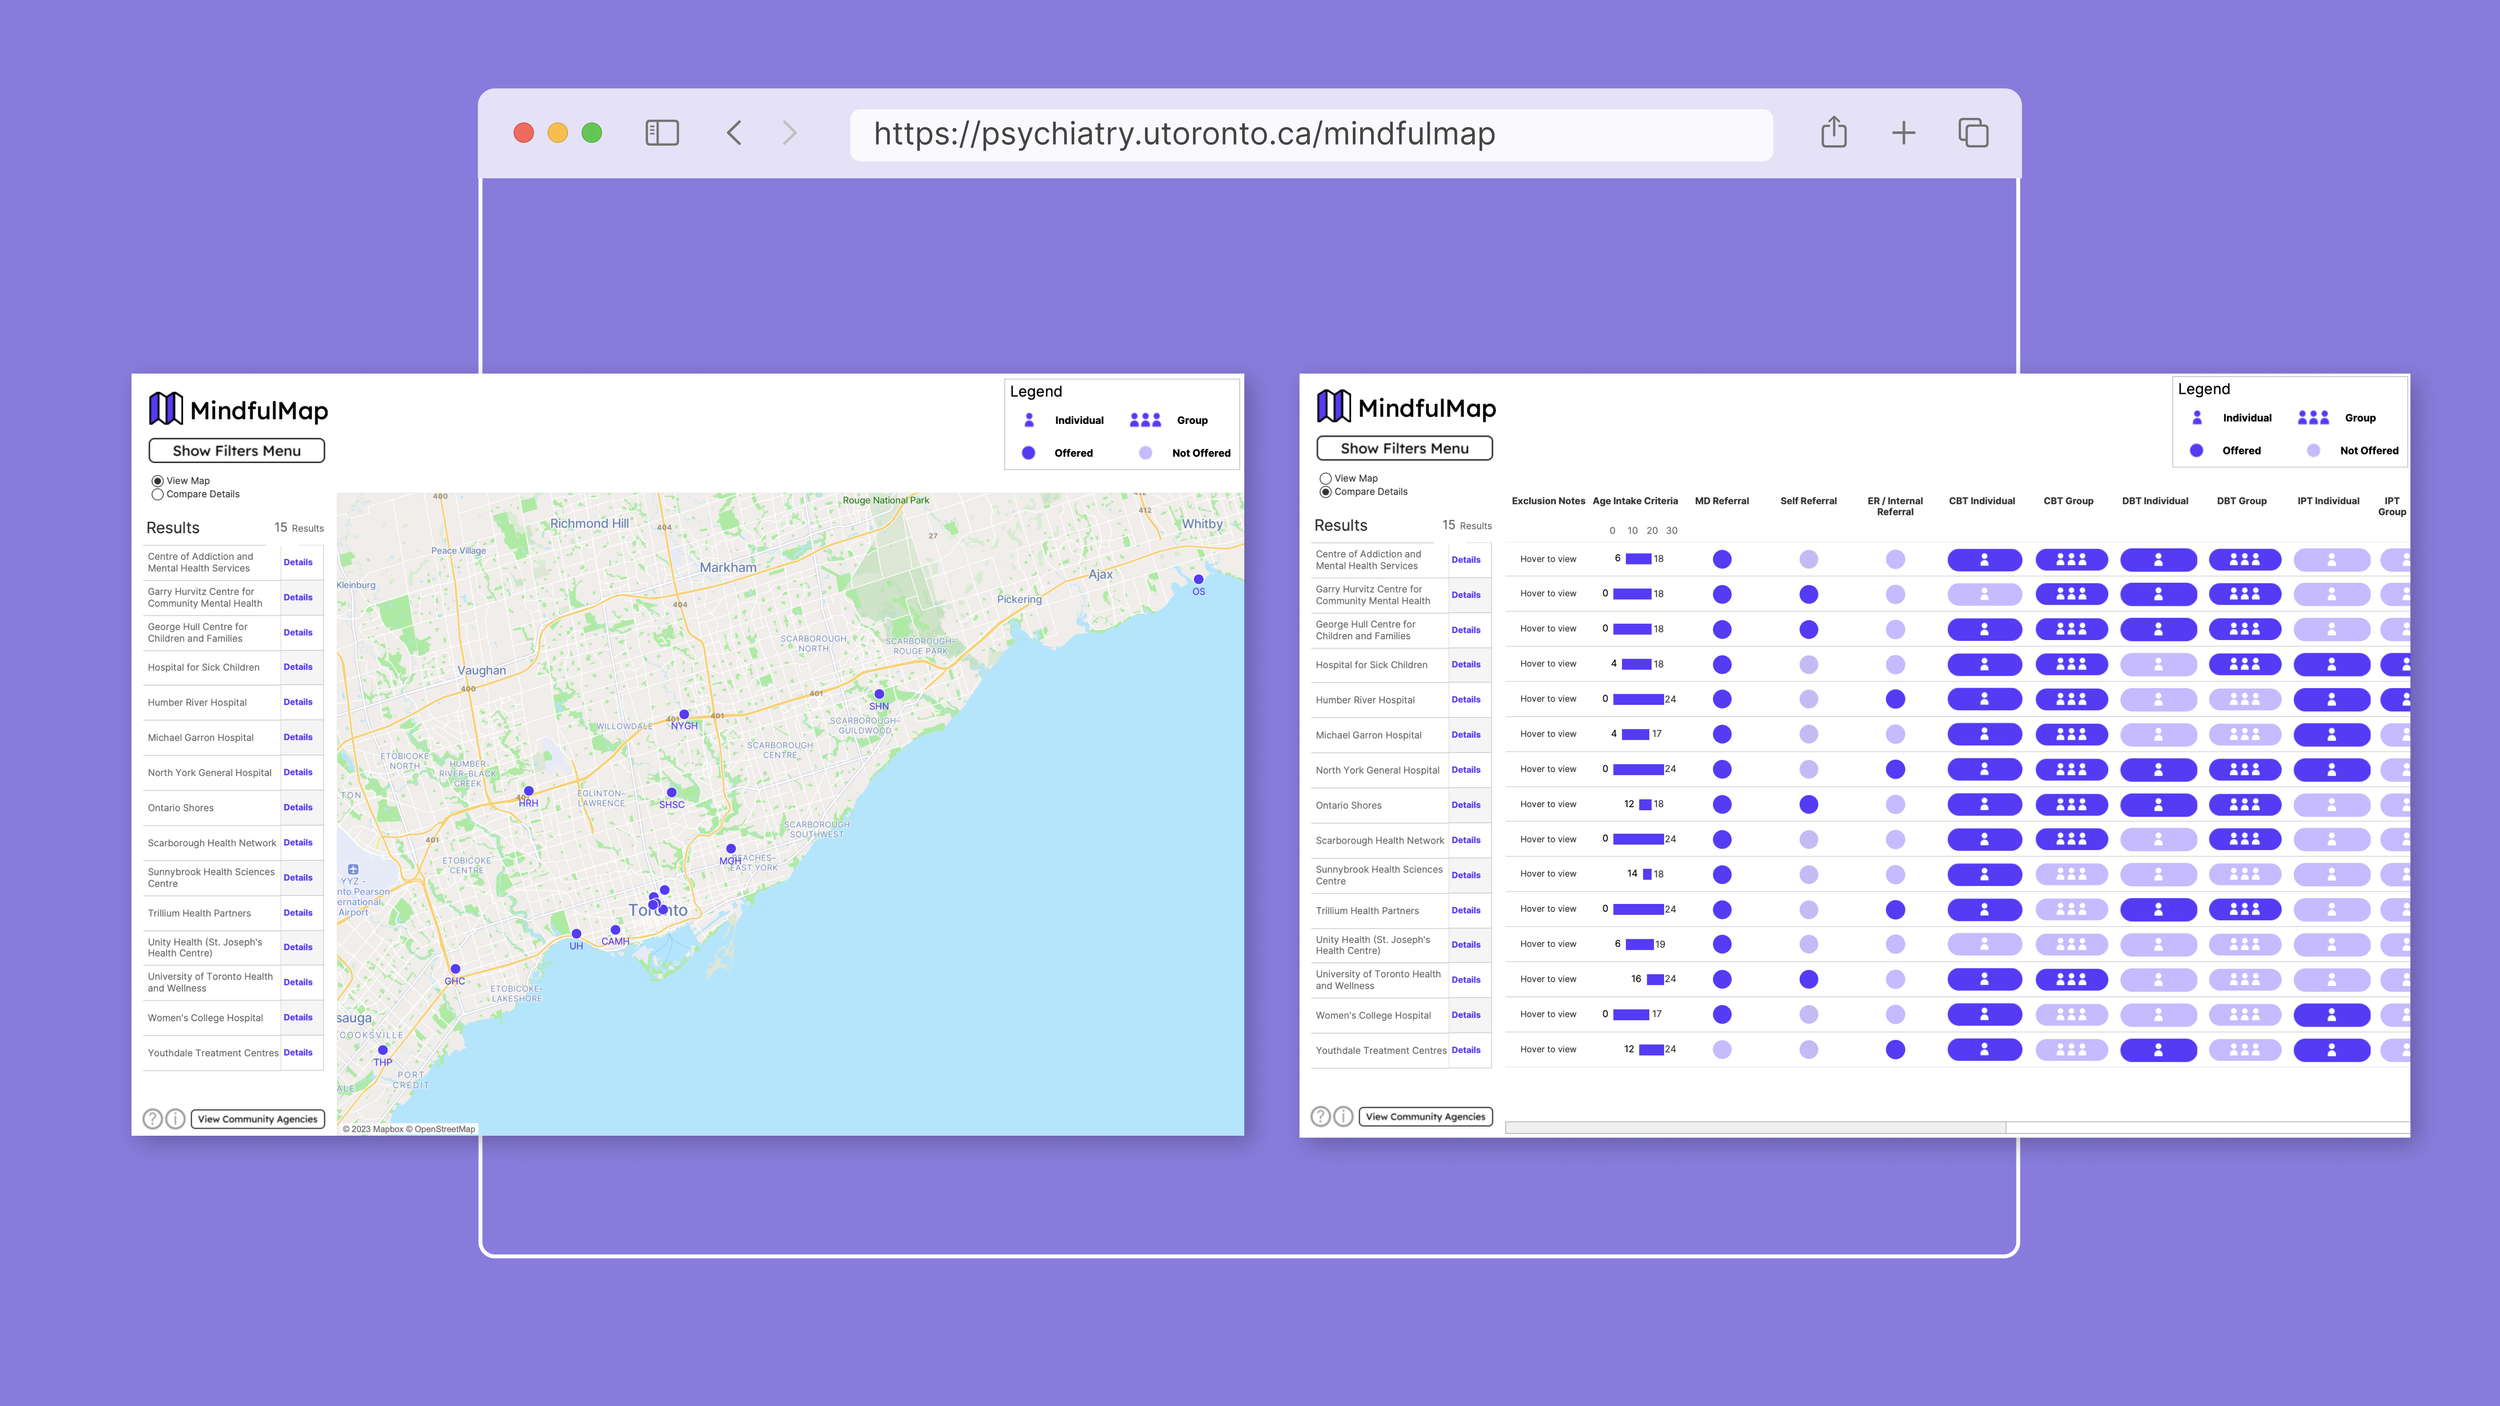
MindfulMap
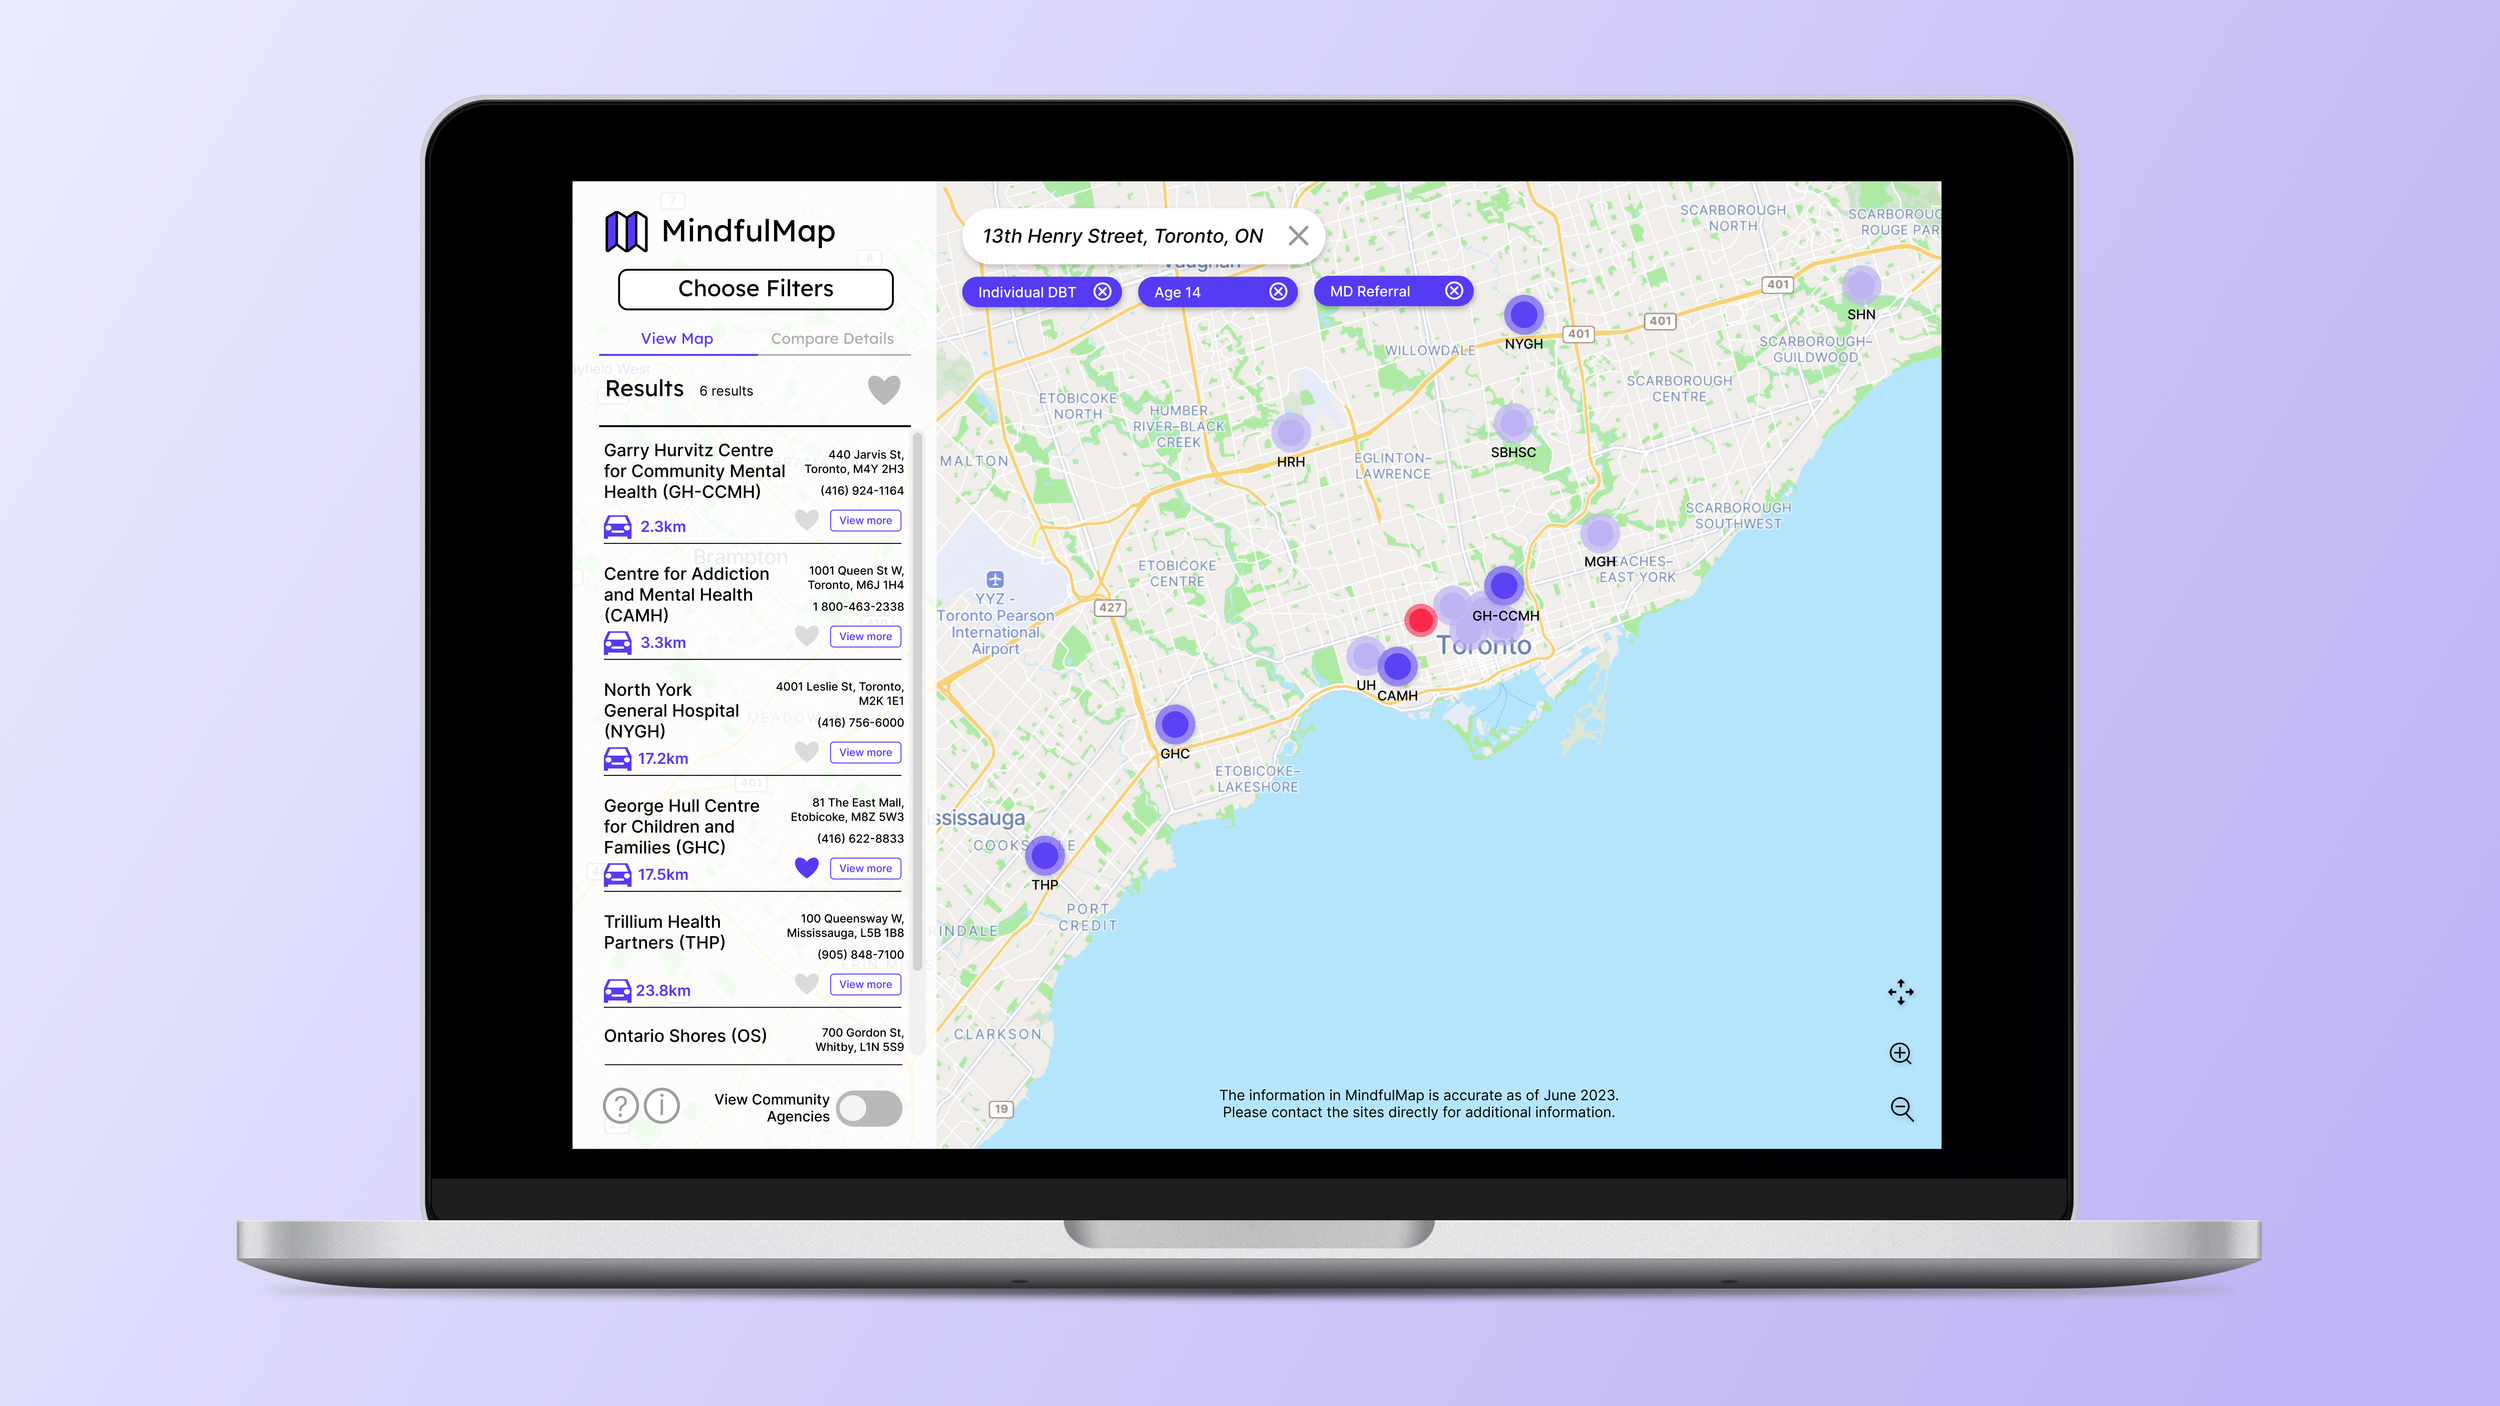
MindfulMap is an interactive experience that provides a snapshot of the services available across 15 clinical sites in Toronto. The goal is to help clinicians and hospital managers navigate services for the kids, youth, and families.
Advisory committee
Tools
Figma, Miro, Tableau
Skills
Research, UI/UX design, Data Visualization, User Research, Wireframing, Prototyping & Usability Testing.
Audience
Clinicians and Hospital Managers
BFA, BA, Hons BSc, MScBMC, CMI
Associate Director/Associate Professor
University of Toronto
Collaborators
Joshua Koentjoro
Date
2022-2023
Format
Dashboard, Interactive
Nick Woolridge (Primary Advisor)
BFA, BSCBMC, MSC, CMI, FAMI
Associate Professor and Past Director
University of Toronto
Stephanie ameis (Content Advisor)
Michael Corrin (Secondary Advisor)
Associate Director, Cundill Centre for Child and Youth Depression; Clinician Scientist
Campbell Family Mental Health Research Institute, CAMH
Challenge
Although the child and youth mental health hospitals in Toronto are connected by affiliation, each clinic provides services, intake criteria and treatments that are specific to the domain they serve. This lack of standardization creates isolated systems that complicates clinical or administrative tasks and exacerbates existing healthcare barriers, especially during opportunities of hospital collaboration. As a consequence, it discourages optimal care and manifests as inadequate patient resources, lack of guidance, and long wait times for the patients.
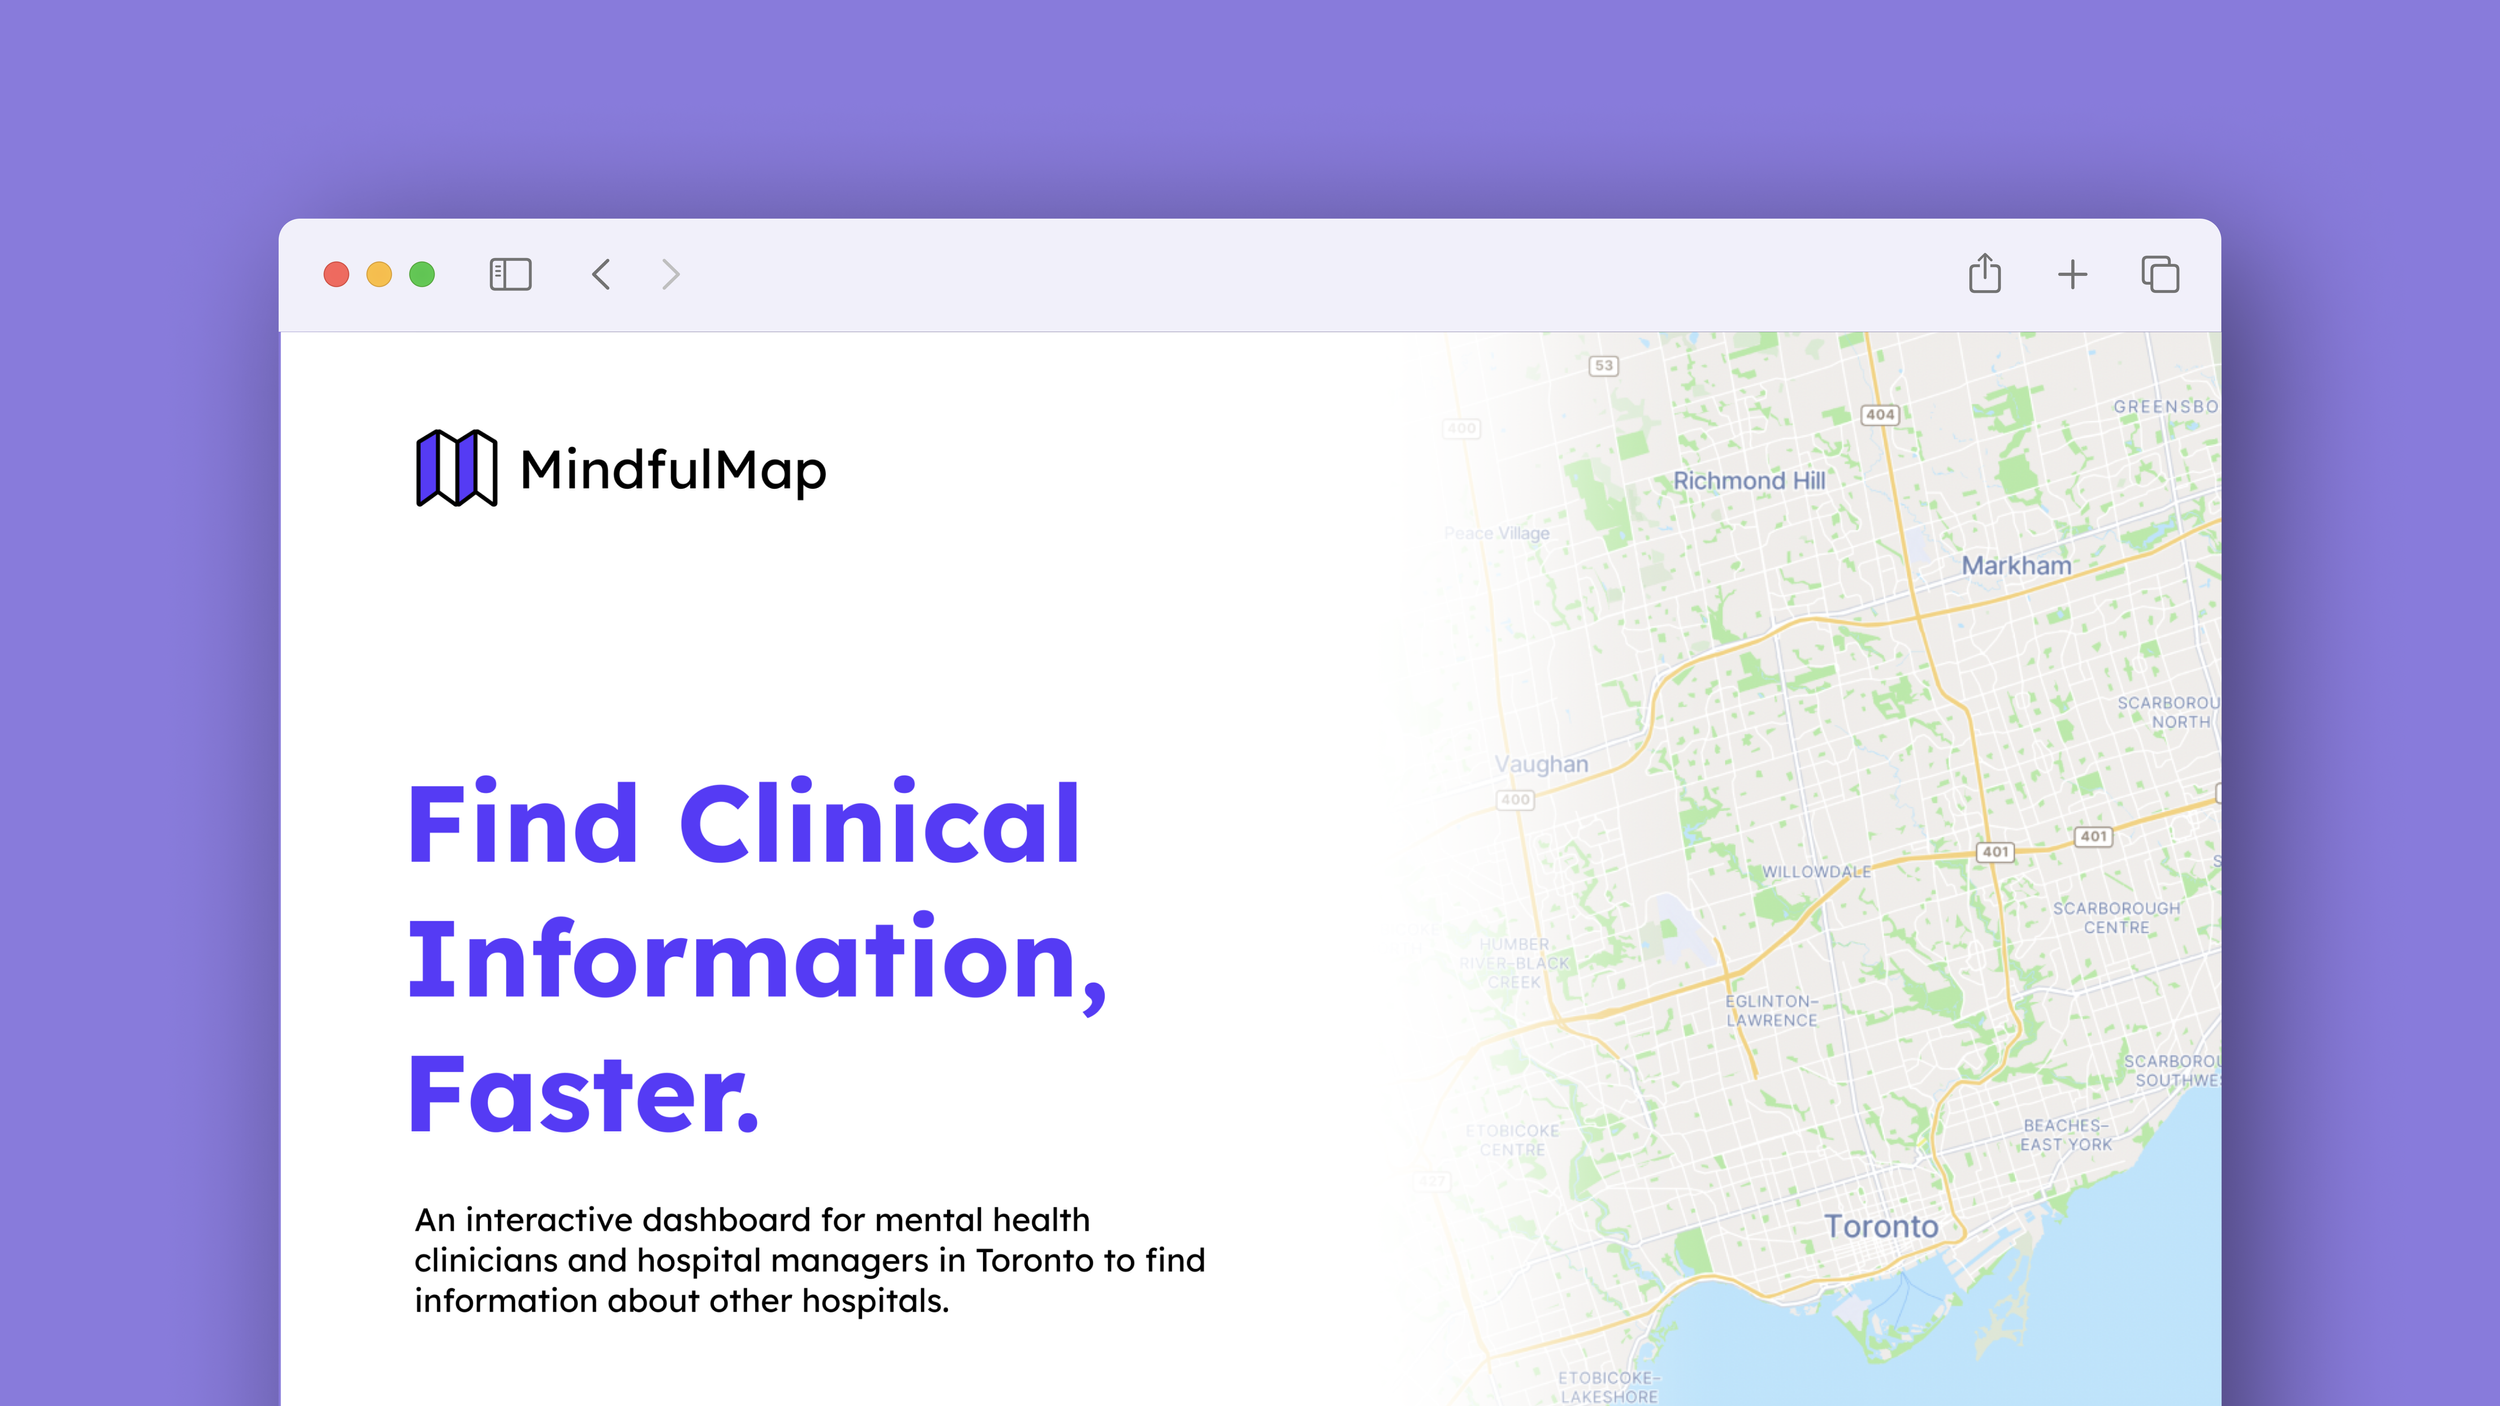
Solution
MindfulMap is an initiative to create a platform that centralizes data from academic-affiliated hospitals in the Greater Toronto Area. It is a tool that allows clinicians to browse information from other hospitals geographically and compare them against each other. The goal of this project is to facilitate collaboration between clinicians by designing a platform that displays hospital information in a way that is useful and intuitive to use by clinicians and hospital managers and that ultimately optimizes the process of referring patients.
Research
Before we could start tackling the challenge, we tried to gain a better understanding of the problem by doing (1) a literature review, (2) a media audit and (3) a user analysis.
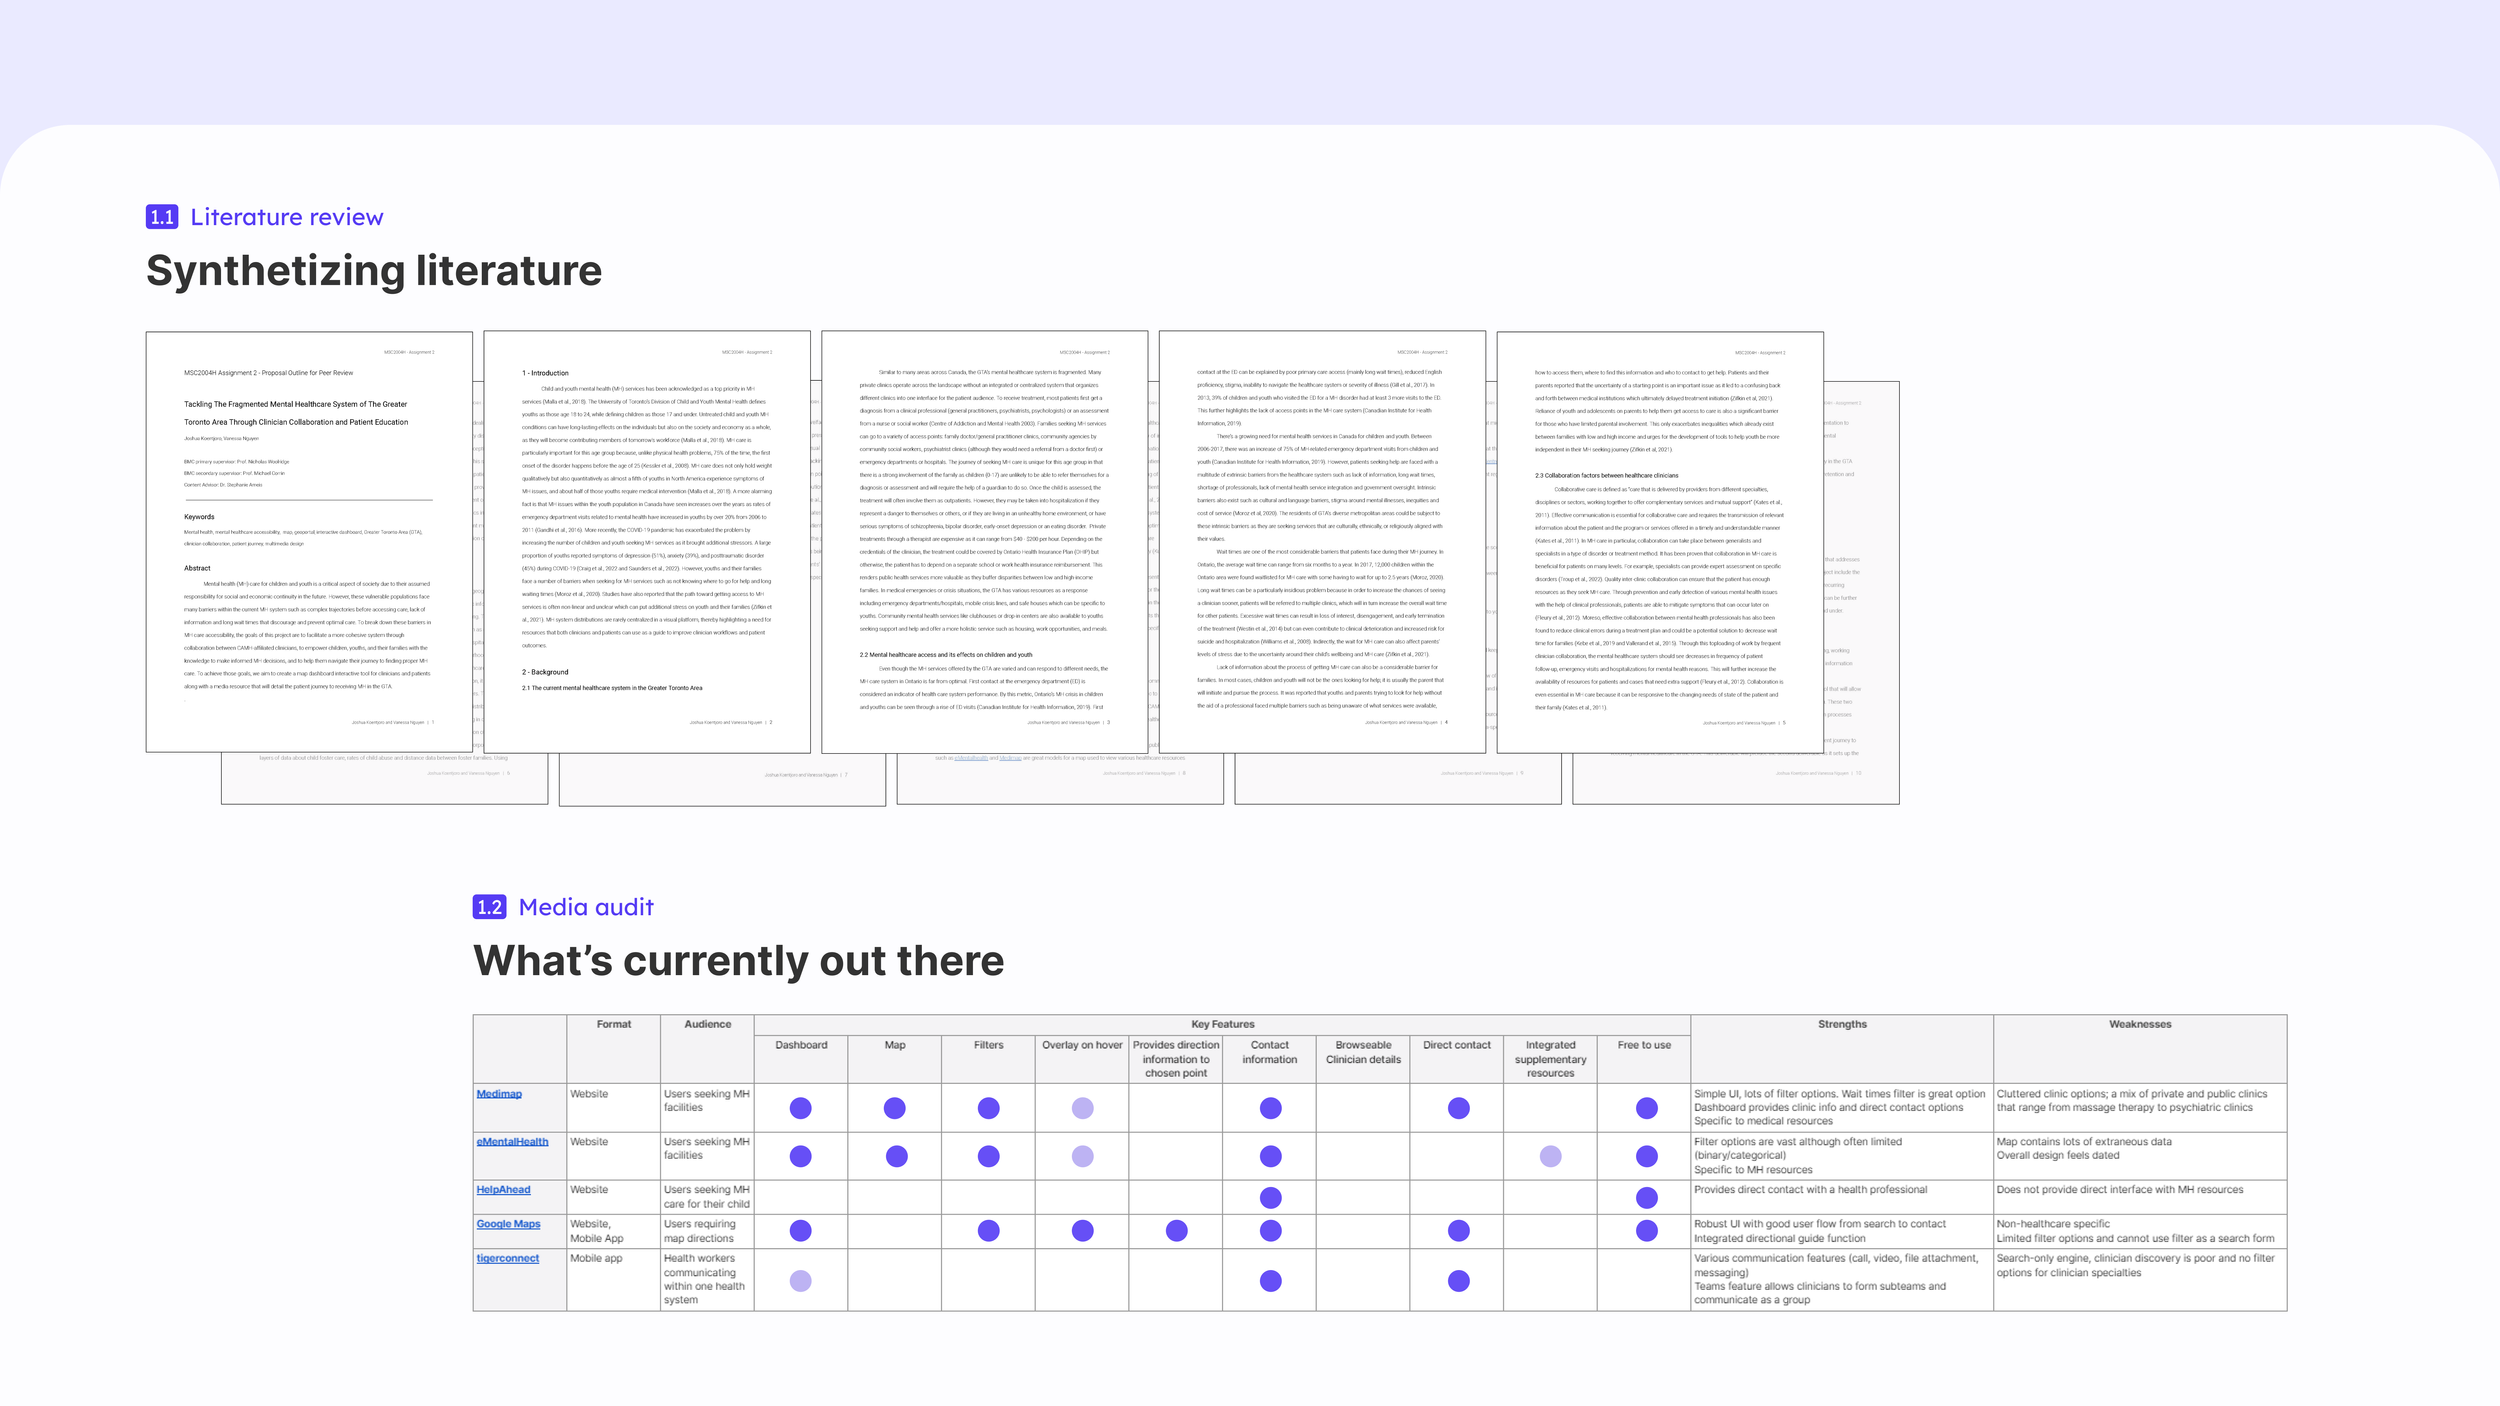
Literature research
We conducted a literature review to understand what were the current barriers in accessing mental healthcare in Toronto for patients and how collaboration between clinicians and hospitals could be a possible solution to those barriers.
Key findings
Media audit
We also conducted a media audit to assess what were the current online mental health resources available, what we could learn from them and where we could potentially fill the gap.
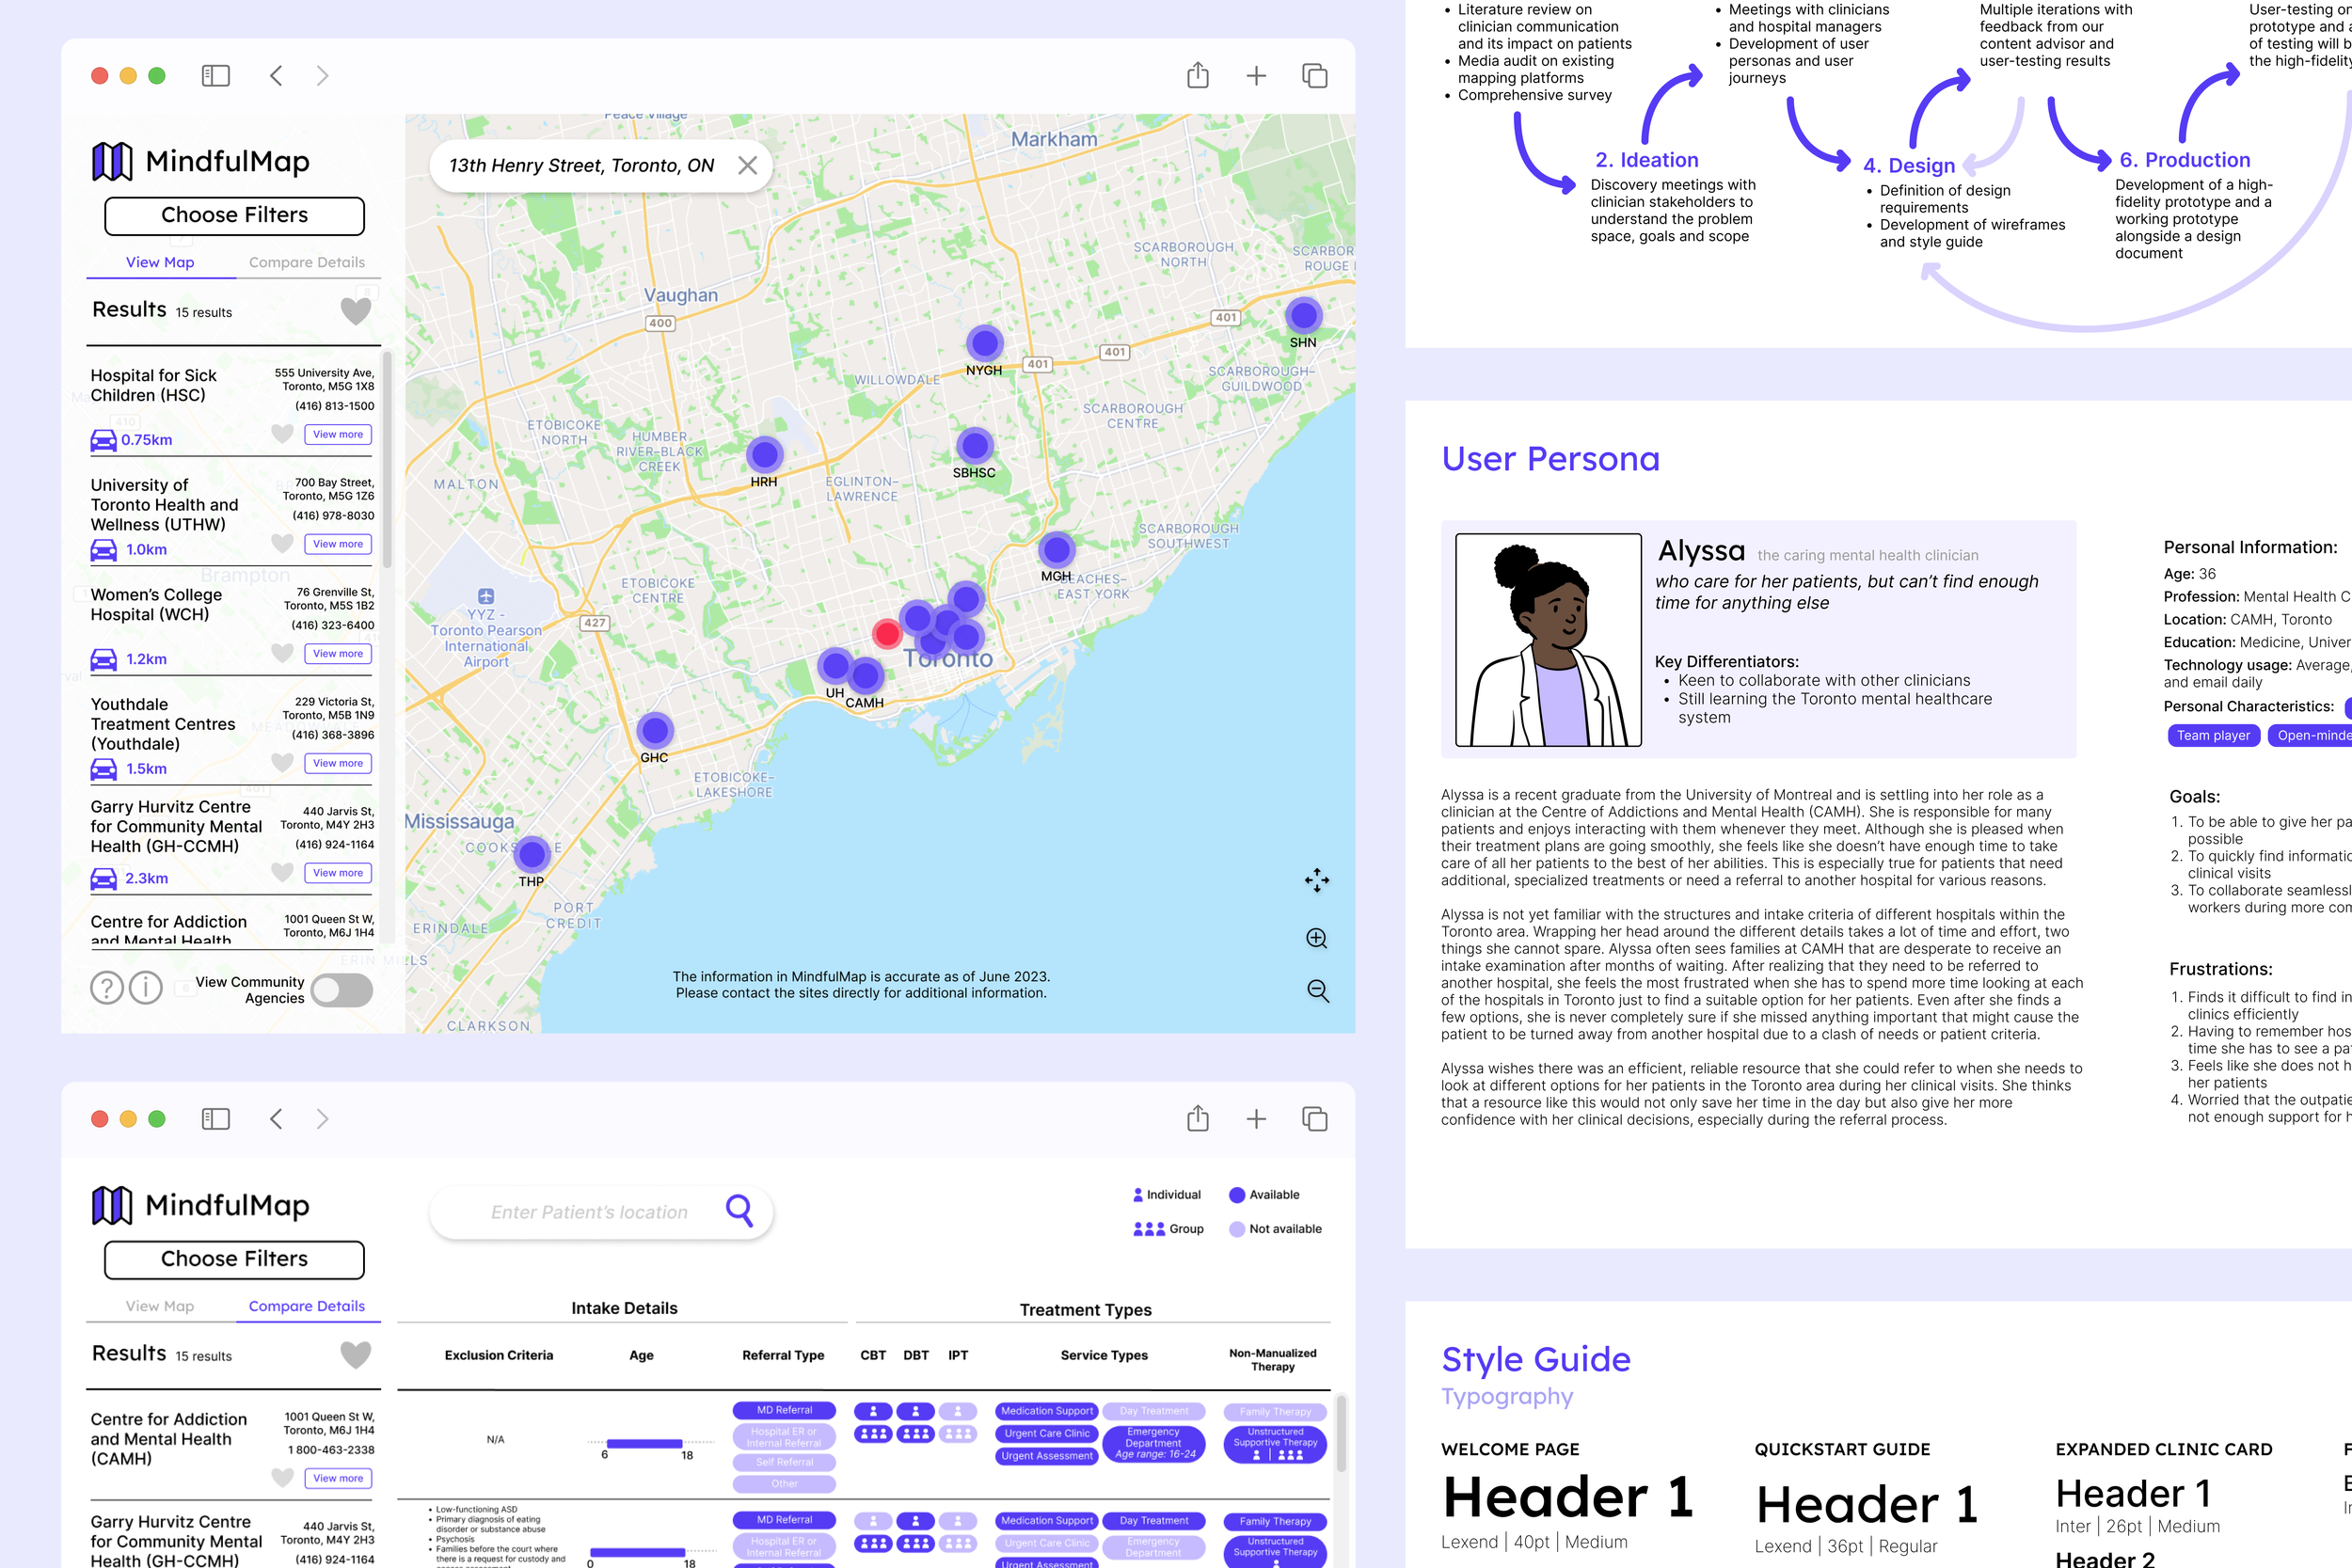
User analysis
Informal interviews were done with our primary audience to learn about their their day-to-day, challenges and goals. This allowed us to create user personas and user journeys that we could reference to during the future stages of ideation and design.

Through our extensive research, one of the biggest barriers to mental healthcare for patients is long wait times and waiting exacerbated the state of these patients even more.
On the market, there are many tools that helps patients find mental health resources geographically. However, for clinicians and healthcare professionals, there is currently no platform for finding information on other hospitals.
Talking to our primary audience, clinicians and hospital managers, allowed us to learn that their most valuable resource was time.
Goal and objectives
The initial phase of research helped us have a better grasp of the problem at hand which allowed us to define our scope, goals and objectives.
Goal
To streamline queries for clinic information by creating a centralized tool that can display mental health information efficiently.
Objectives
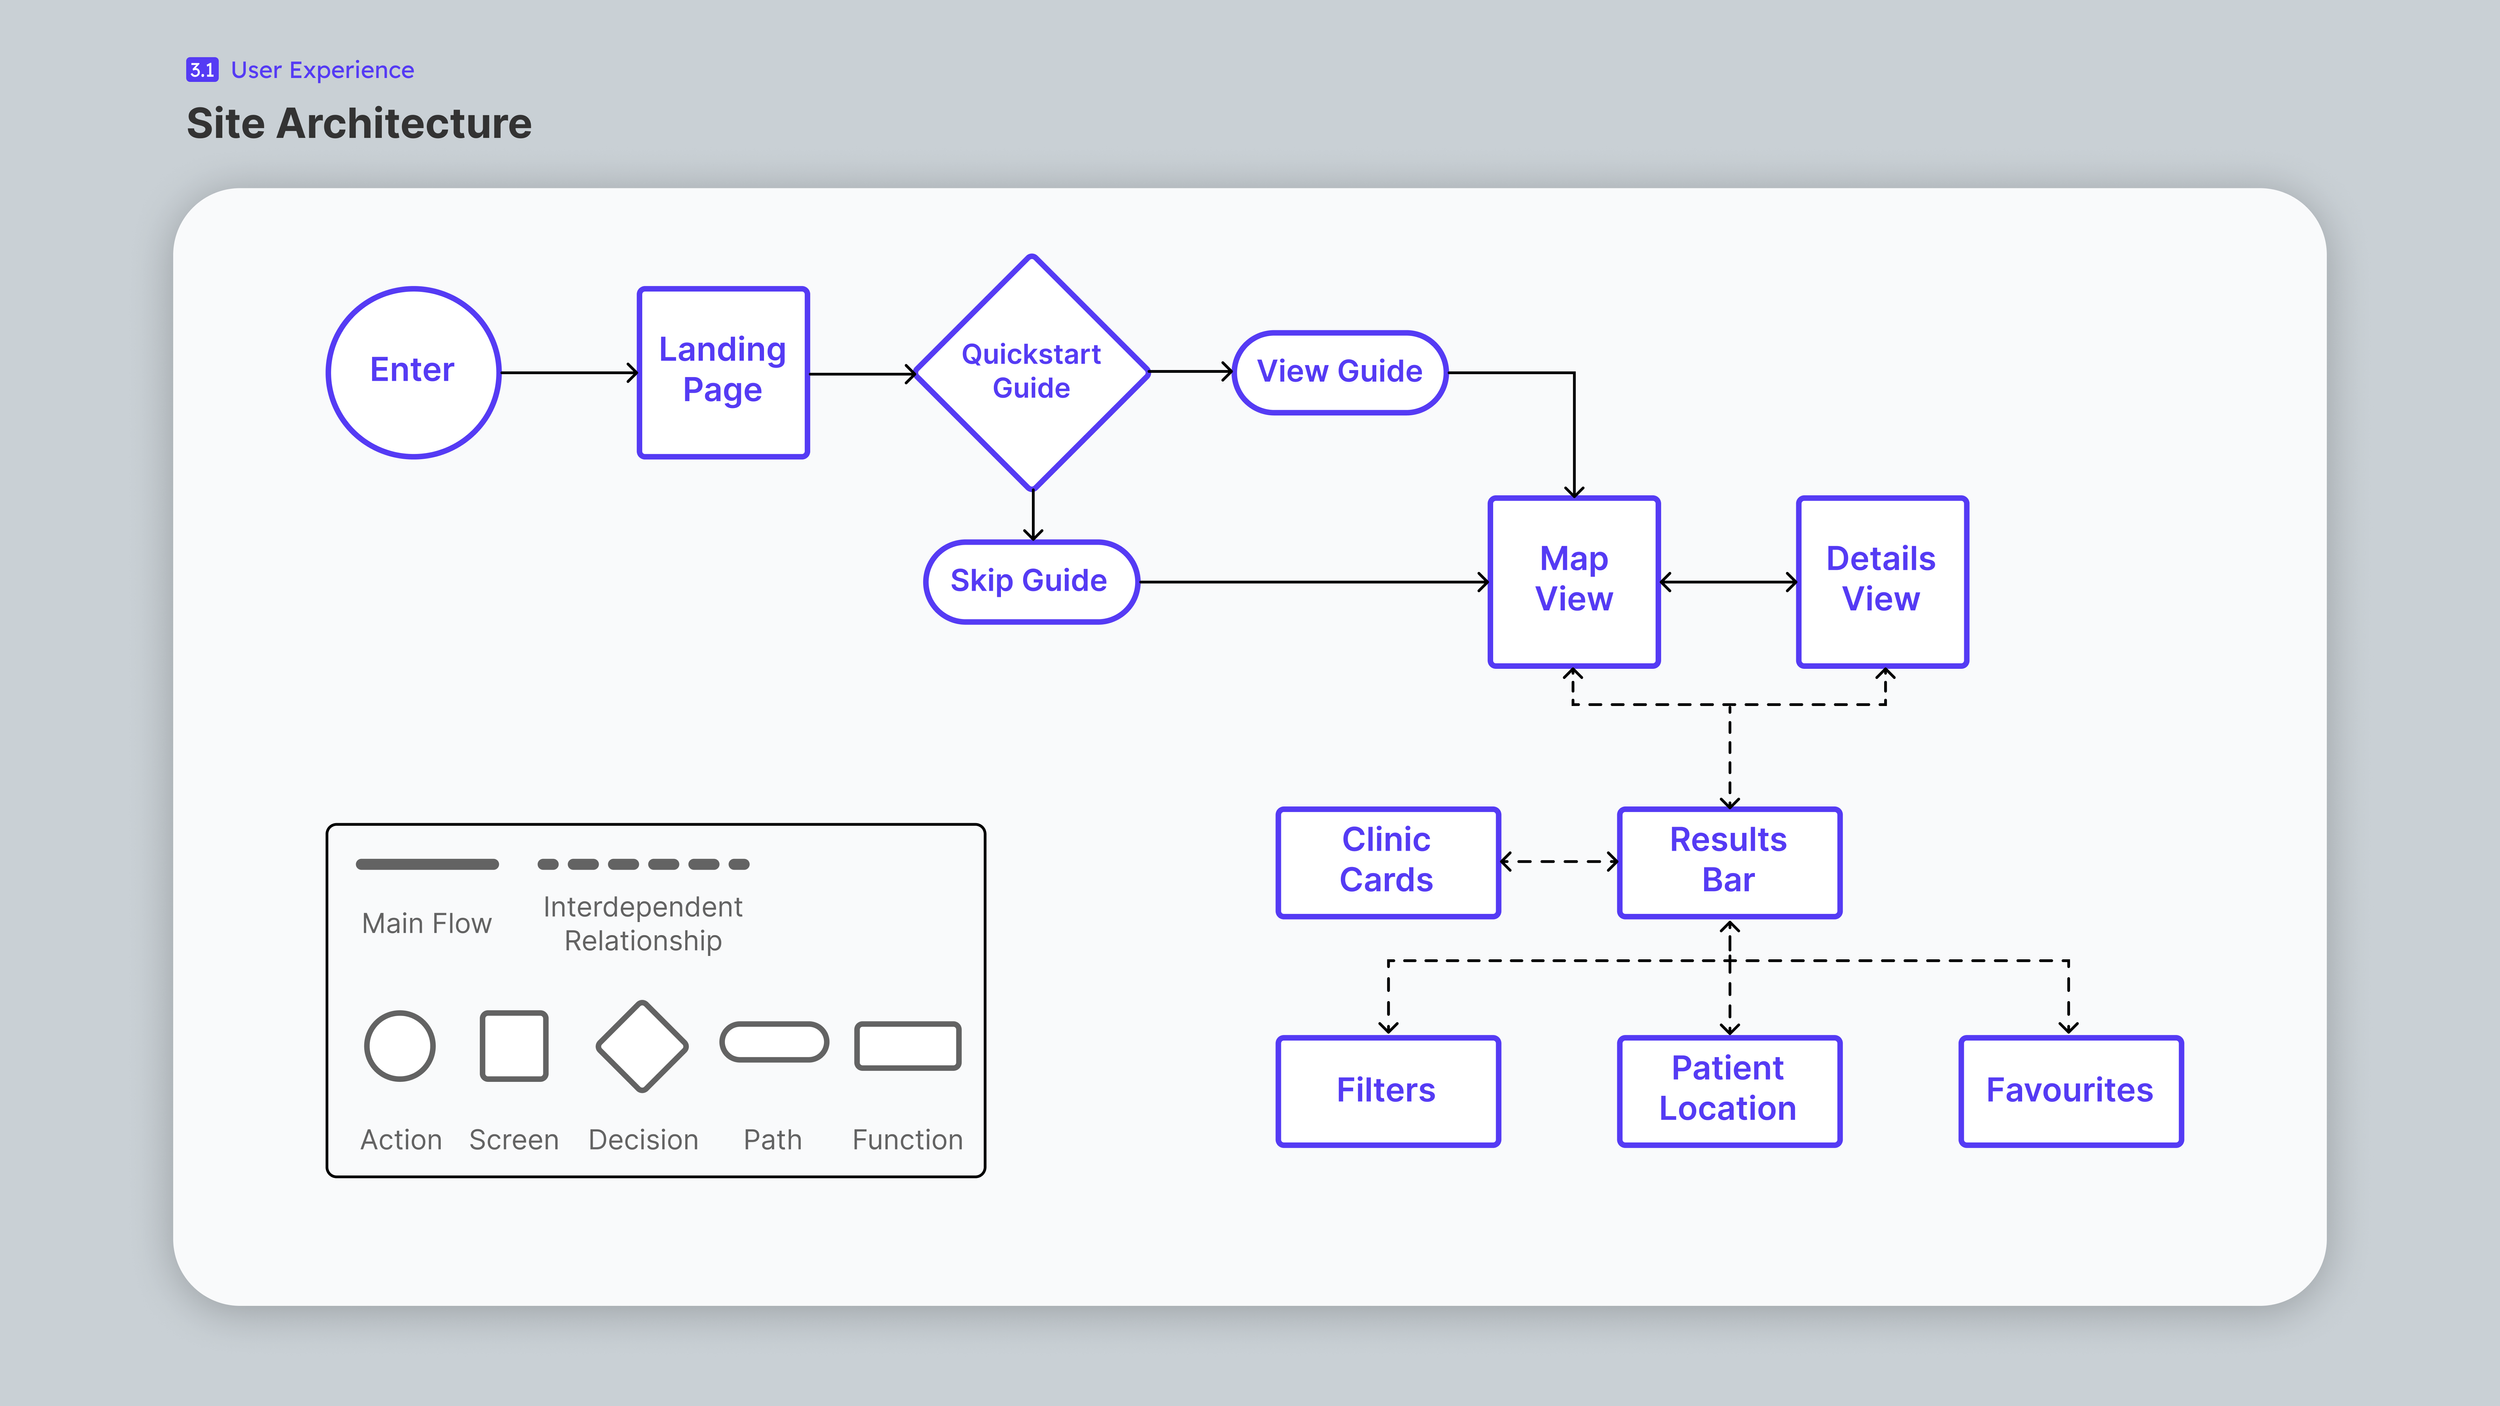
Create an interactive system capable of displaying multilayered data intuitively through the use of graphical representations.
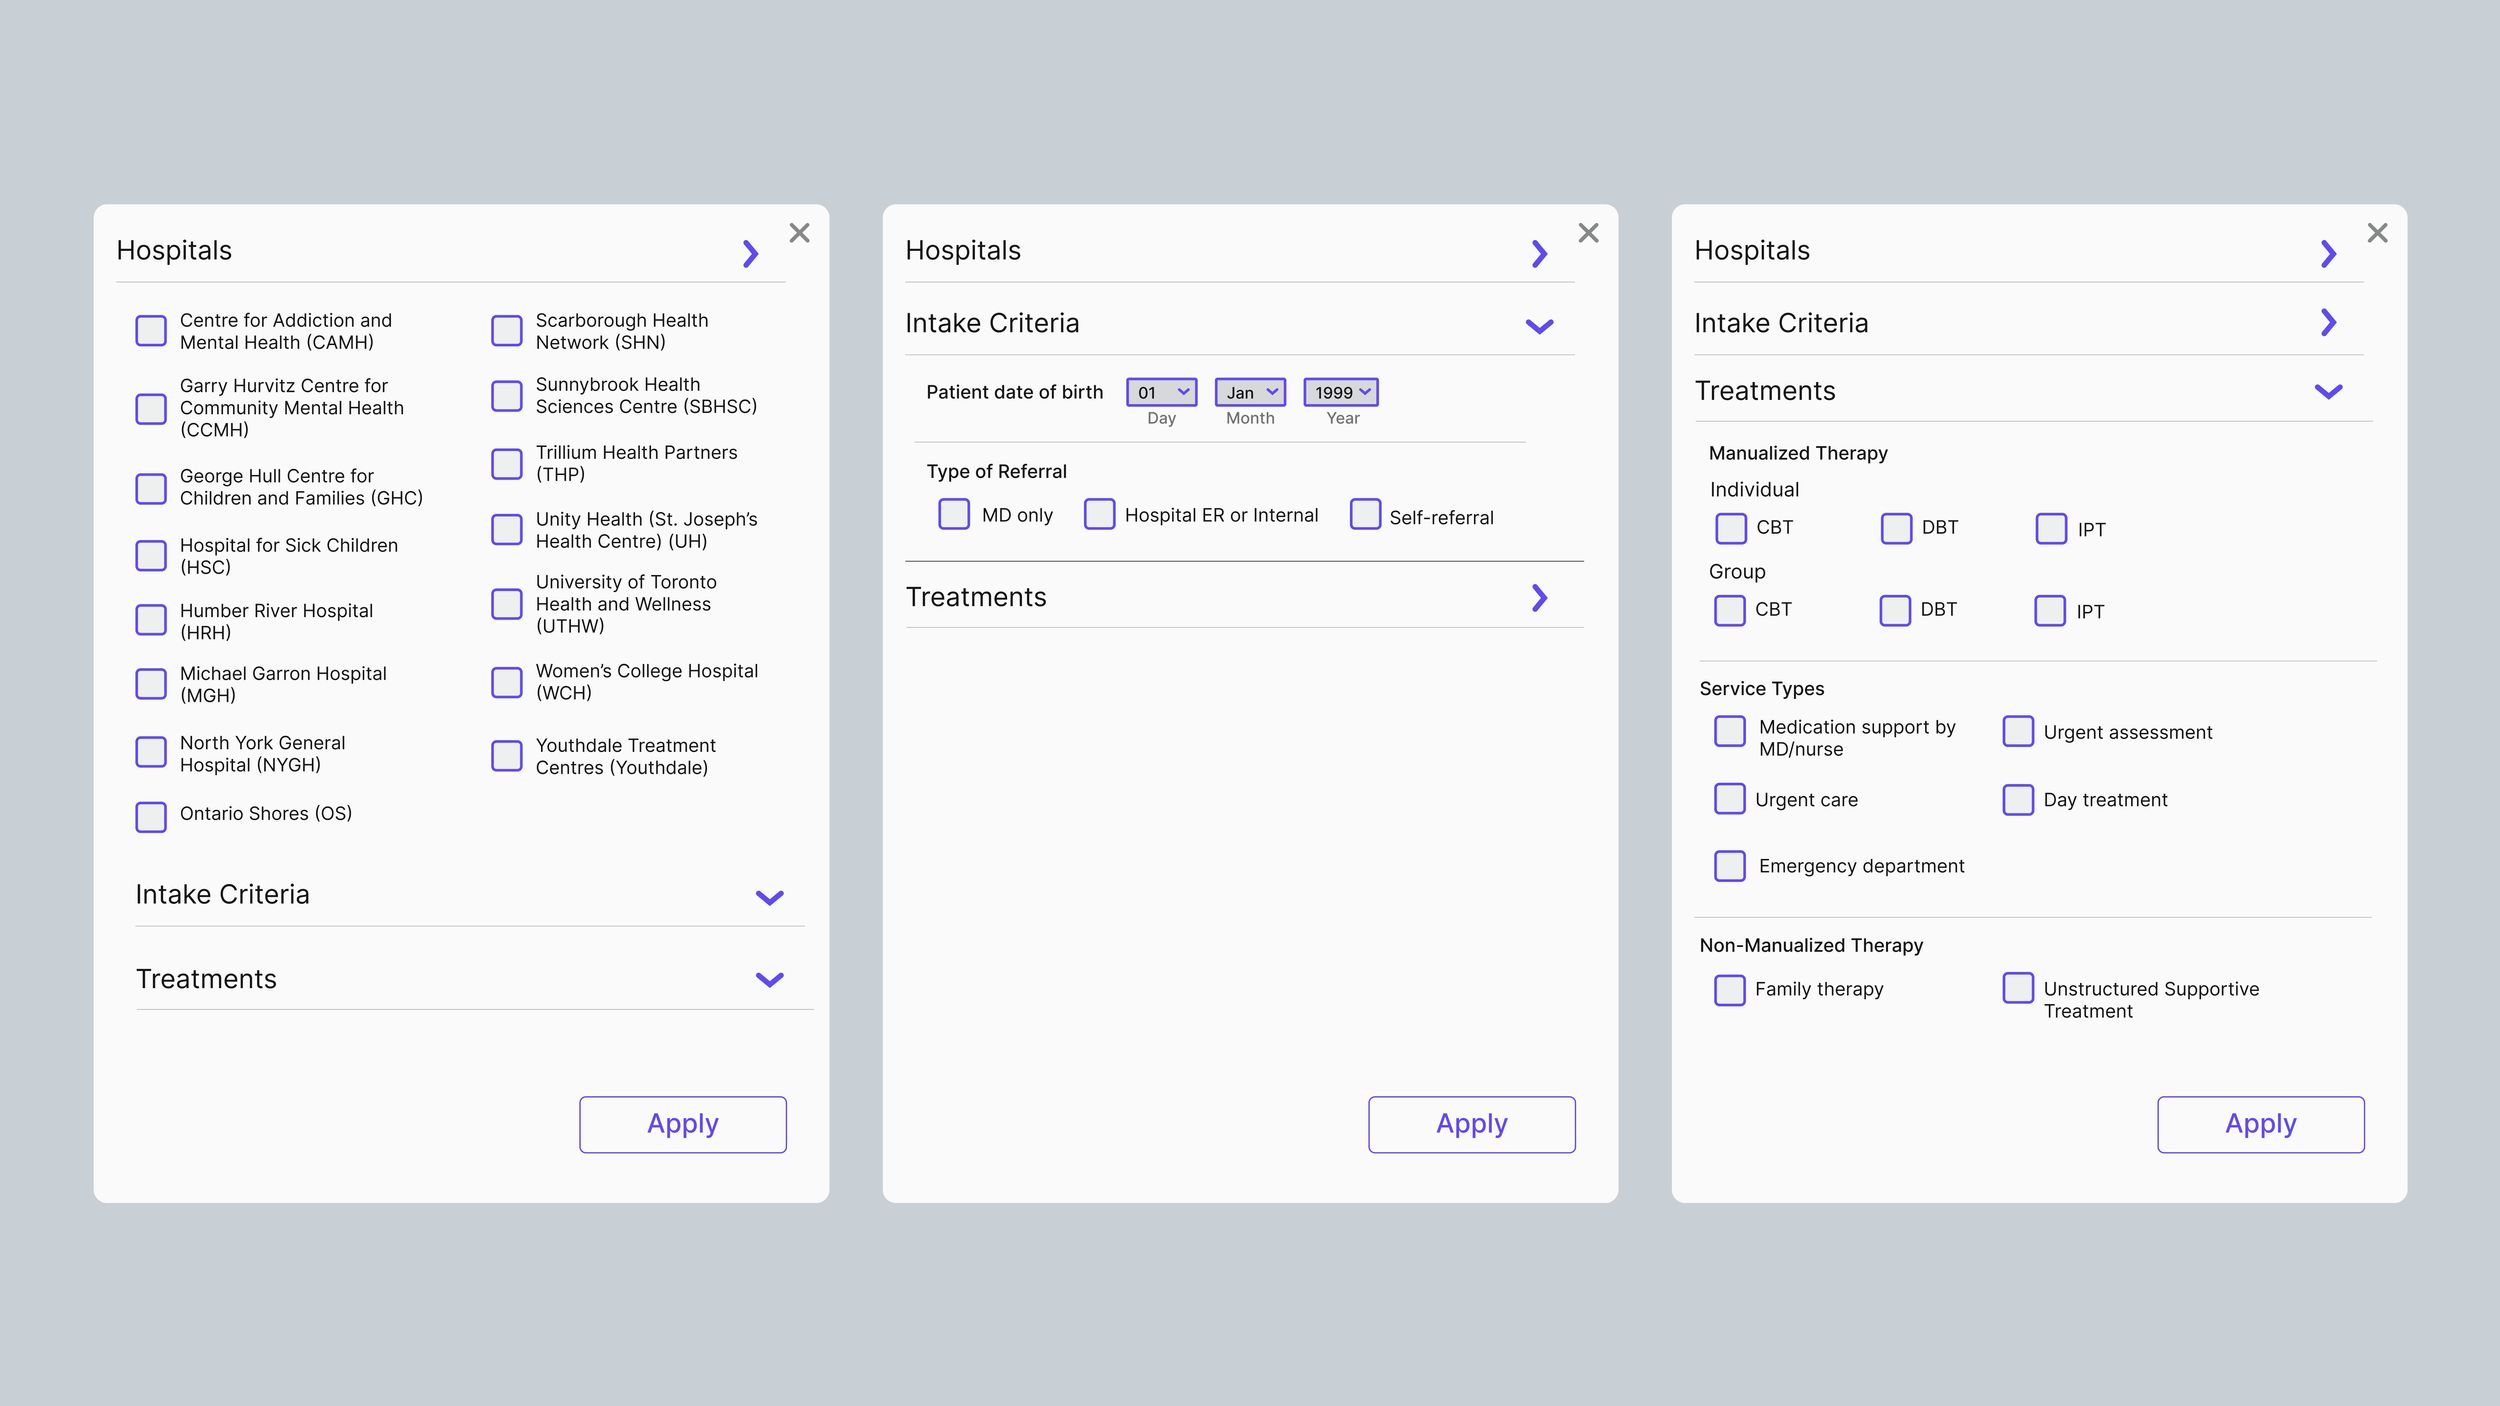
Design and incorporate a filter-based query system that will allow users to refine the data displayed within MindfulMap.
Create a database system that can easily be updated for future iterations.
Design
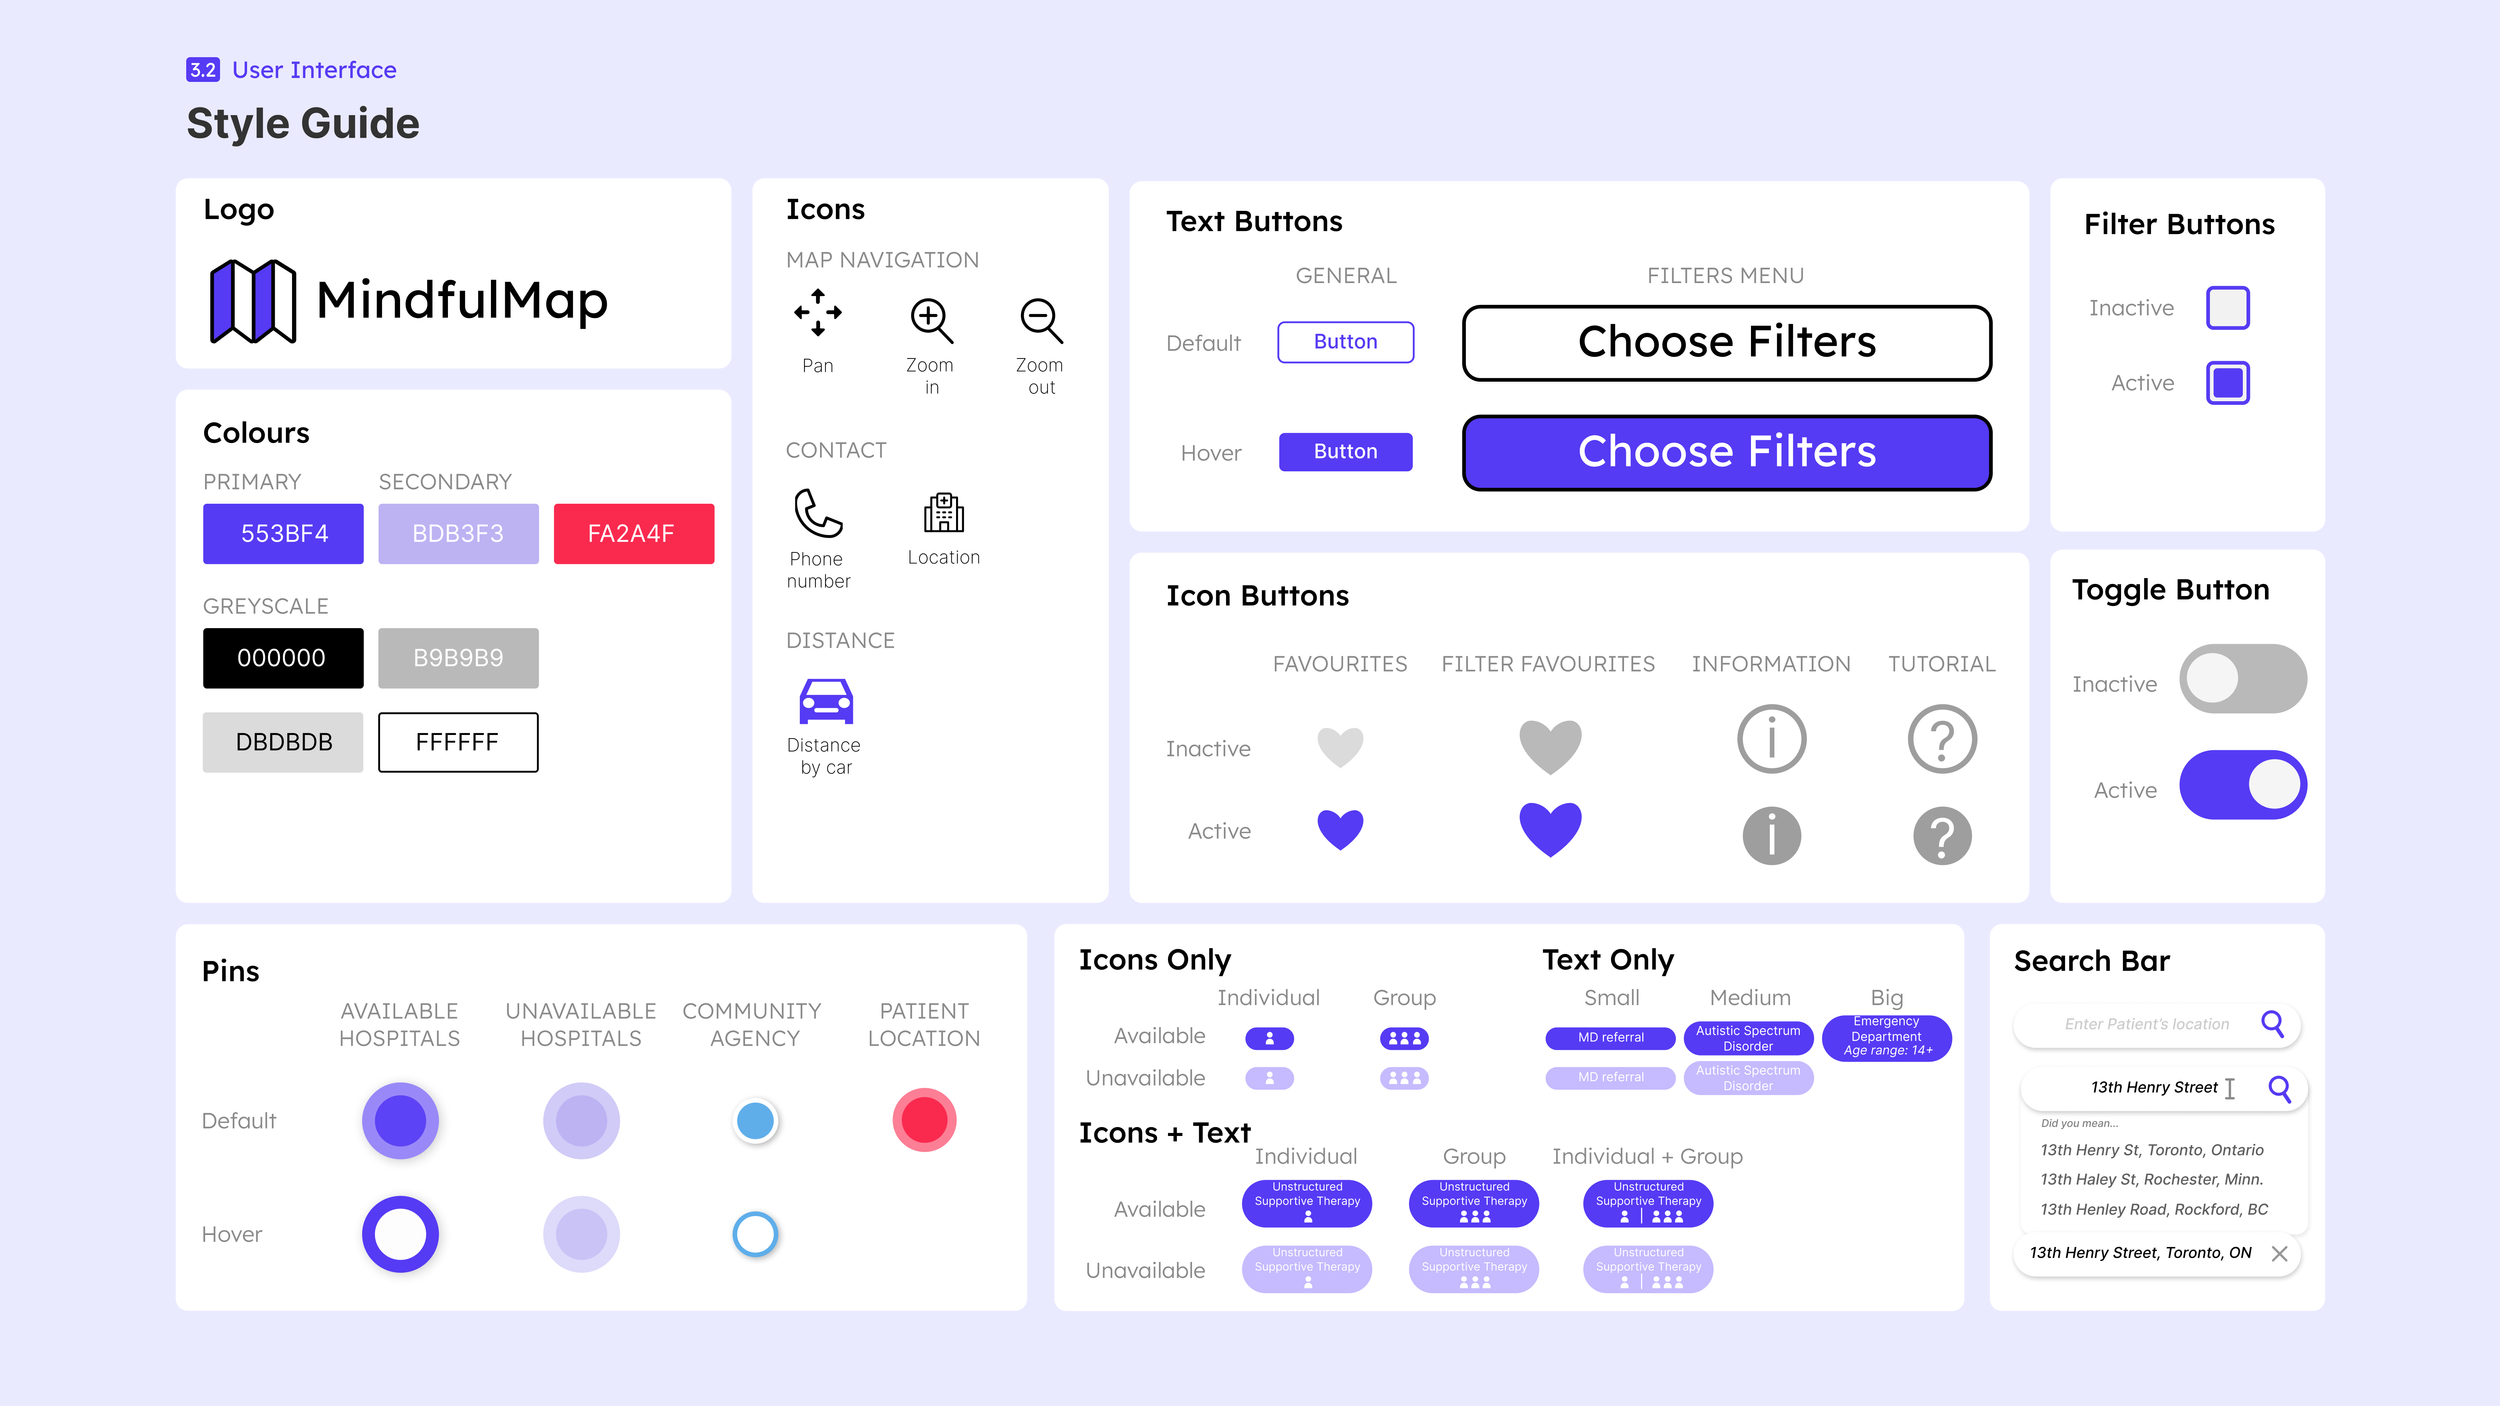
Style Guide
Maintaining a clean and monochromatic UI minimizes visual clutter, promoting a seamless user experience with a focused aesthetic appeal.
This first phase of creation consisted in wireframing, defining the user experience and establishing a style guide.
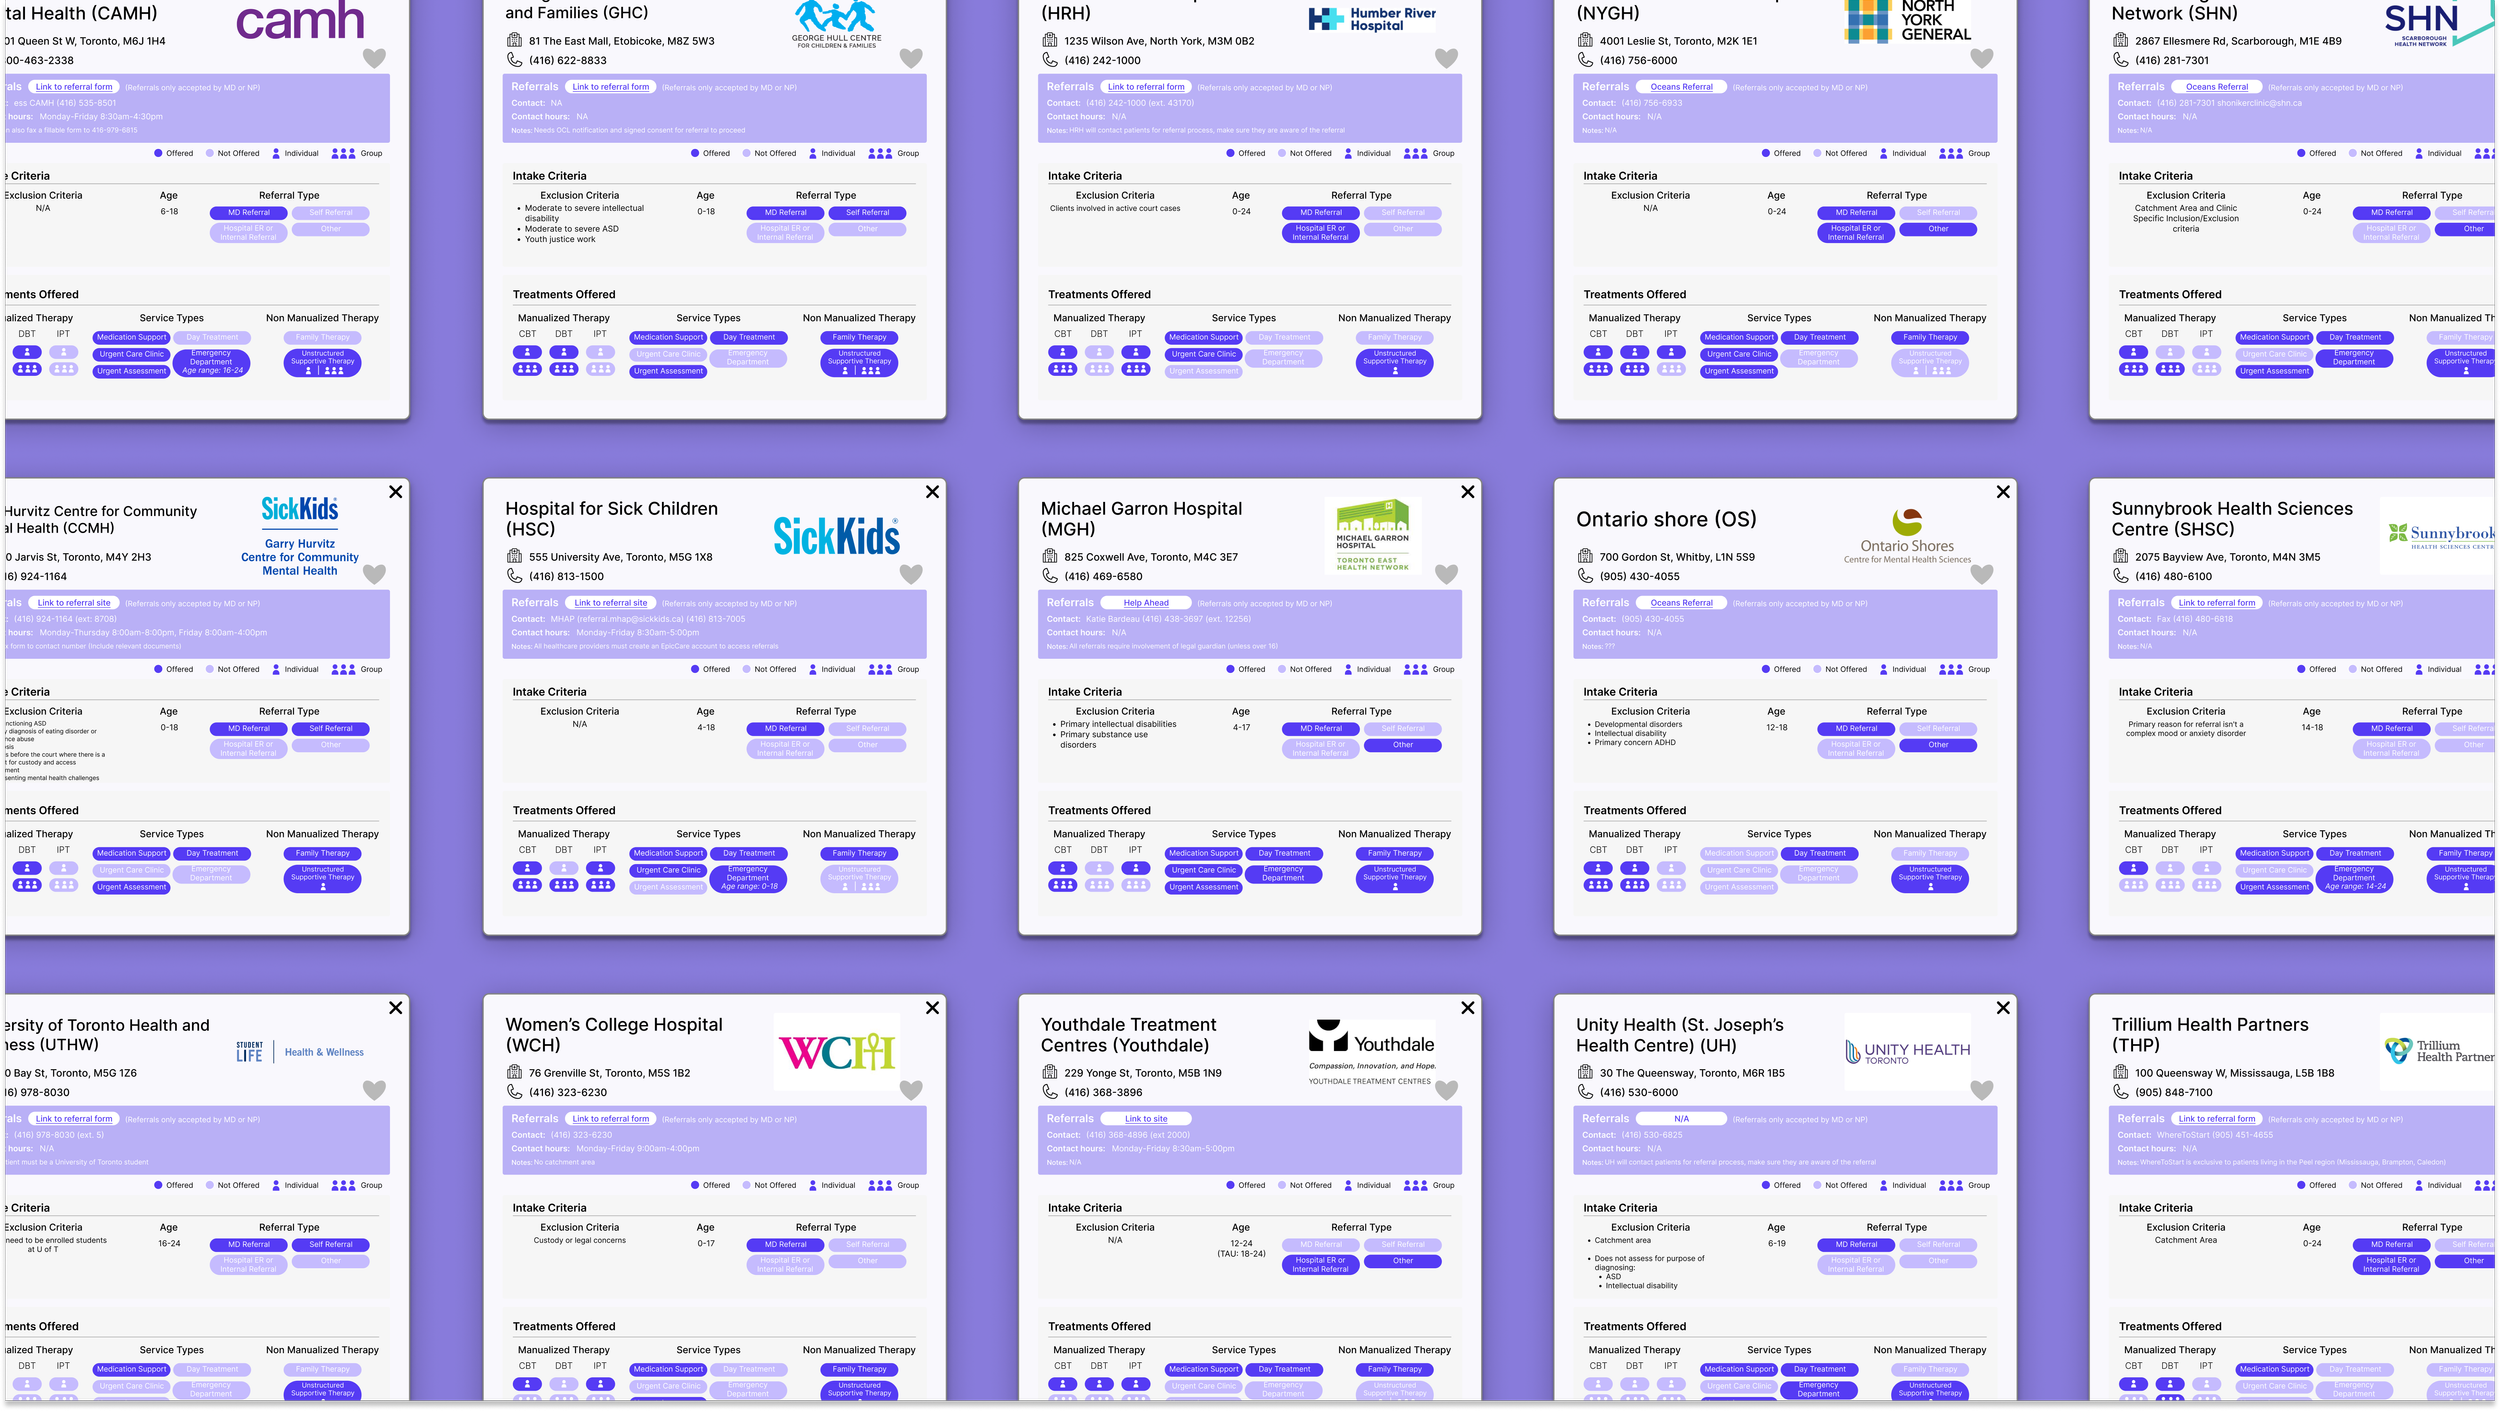
Defining content
Our content advisor came to us at the very beginning with results from a survey sent to 15 mental health facilities in the Toronto area. We were presented with an exhaustive amount of data that we wanted to distill down to only keep what was most important to our users. To do so, we asked our focus group what type of information they needed in their day-to-day and how could we group this information in categories that made sense to them.
Wireframing
Each new iteration was inspired by feedback from our focus group and committee members, additional requests from our content advisor as well as results from informal rounds of user testing. In total, we created 5 versions of wireframes before settling into our final design.
Production & Final Design
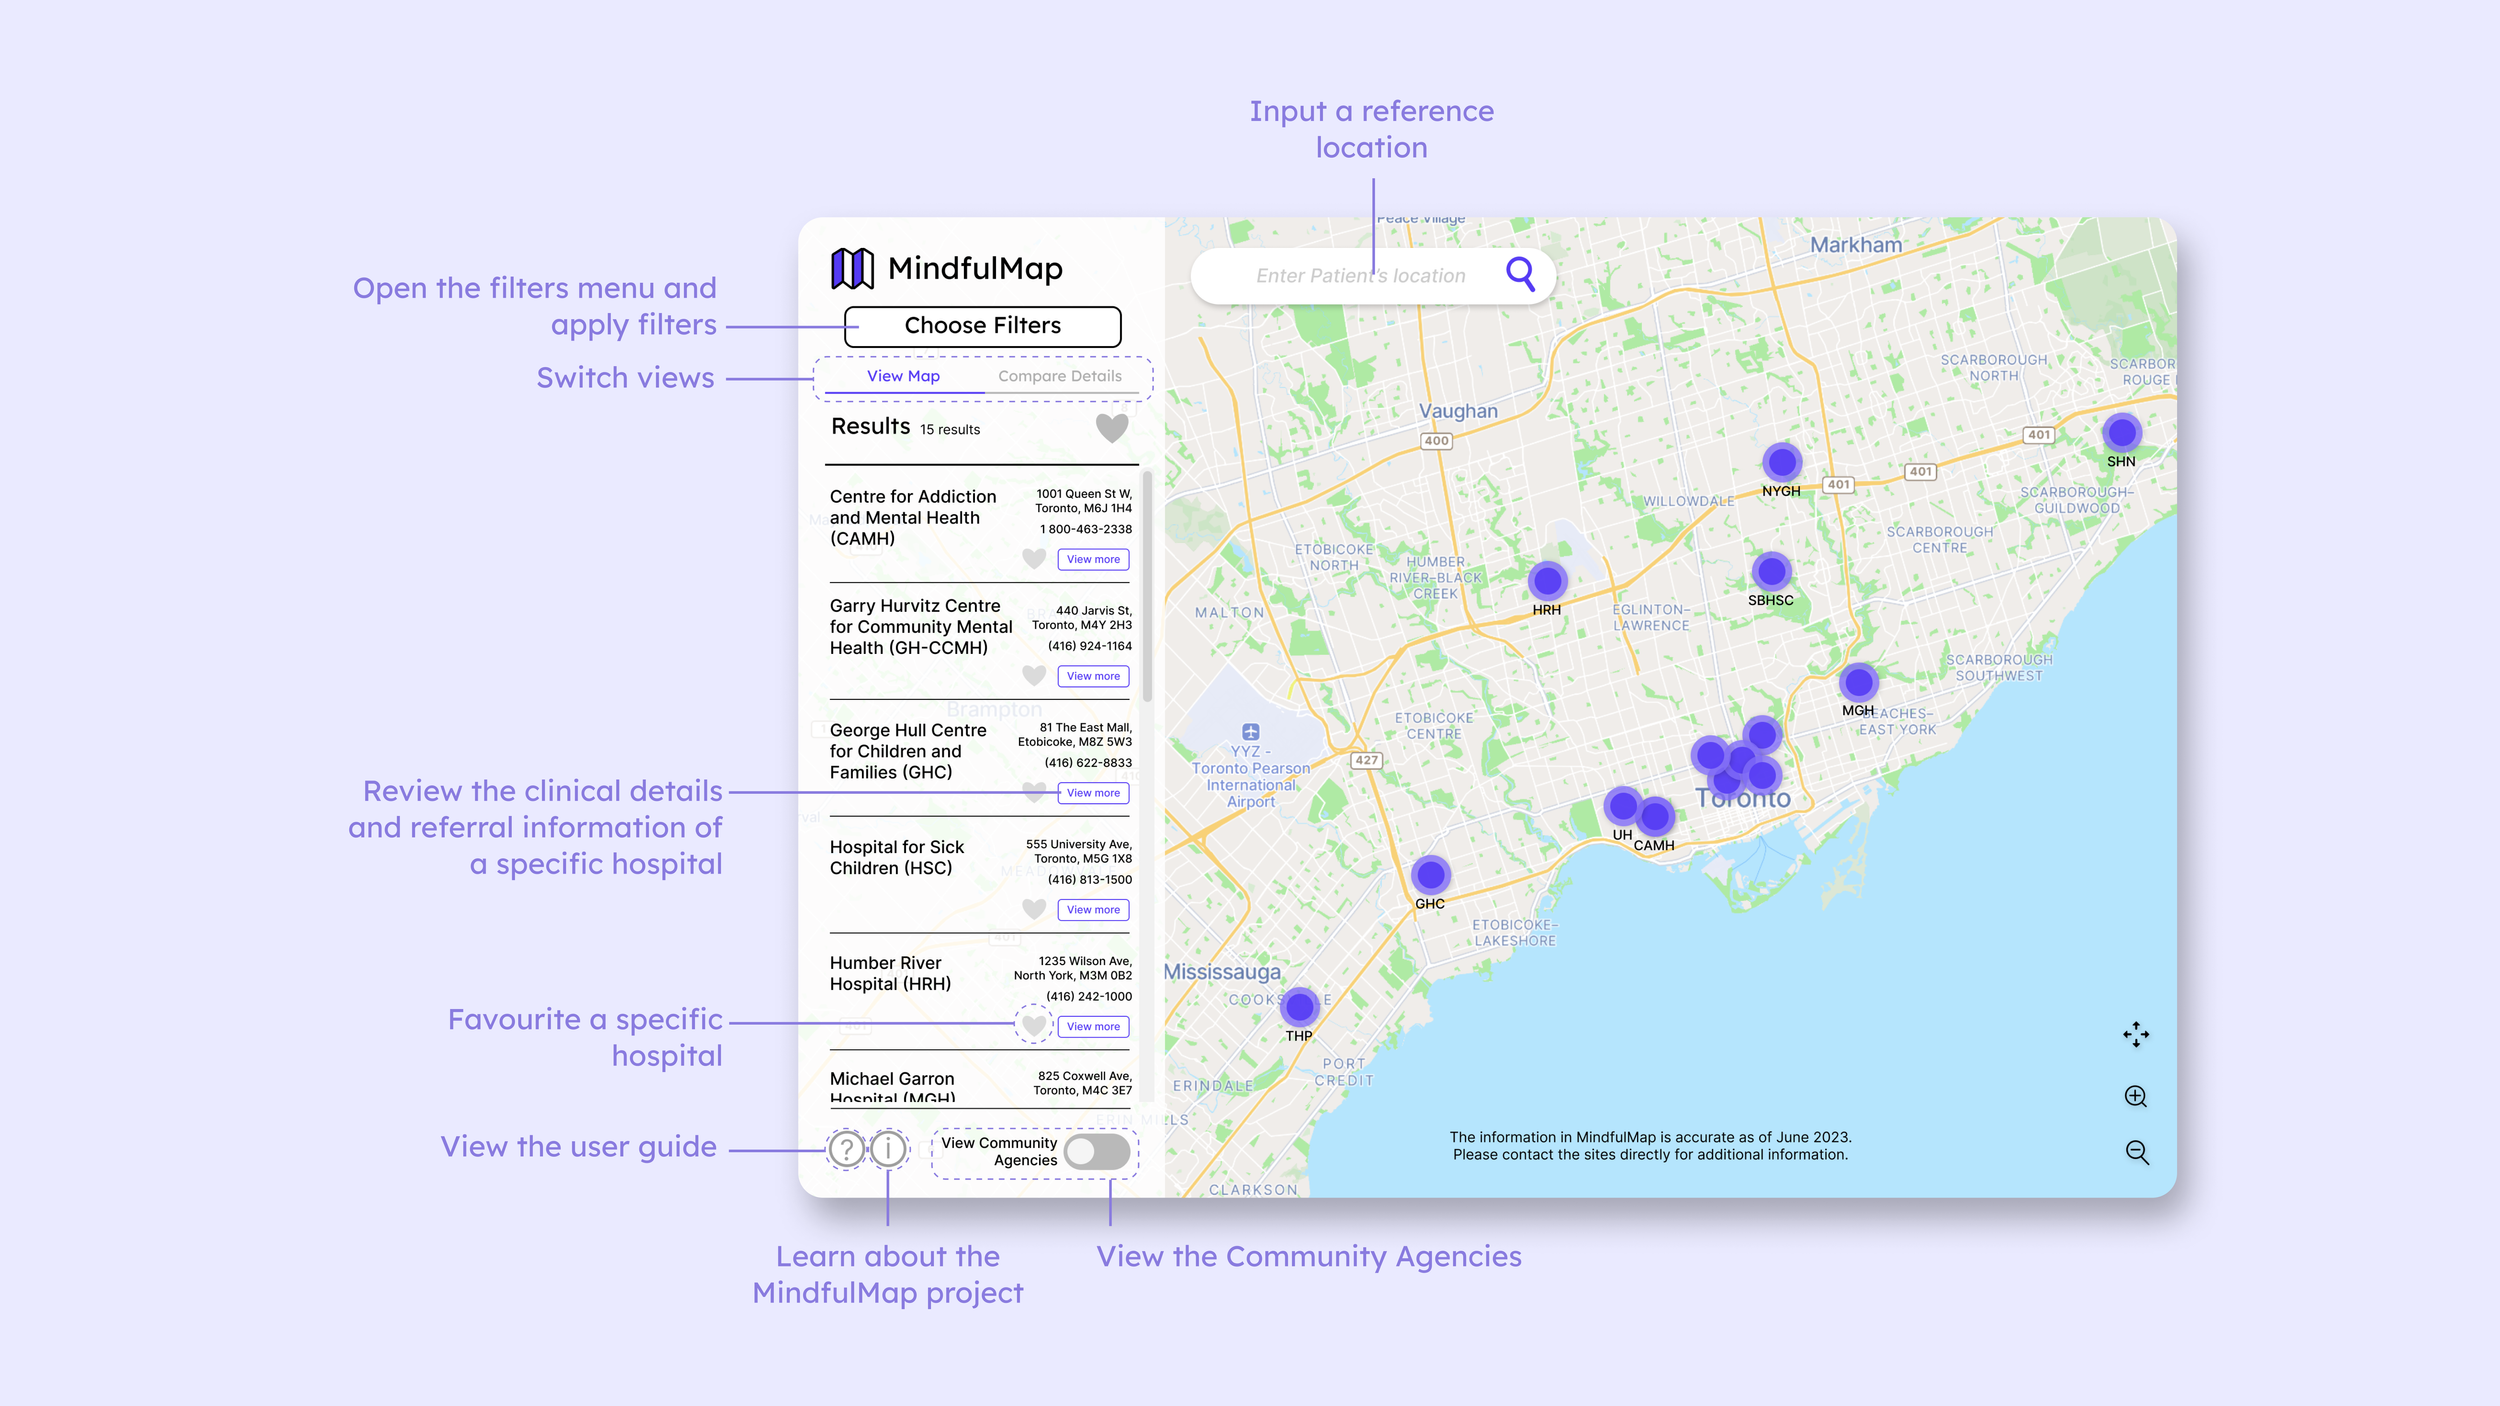
Launch
The working prototype of MindfulMap is available to public use on the University of Toronto Psychiatry Department website.